
What is a reporting tool?
A reporting tool is a system that connects to data sources, retrieves information, and presents insights through graphs and charts based on the input data. These applications are typically part of a business intelligence suite and aid in the decision-making process by offering detailed insights that provide greater visibility over data.
These tools present data in an appealing manner, making it more readable, useful, and presentable. There are two main types of reports: static reports, which cannot be modified by the end-user, and interactive reports, which allow users to delve deeper into the data, navigate, filter, sort, and view it in various ways.
The best reporting software can generate different types of reports, including those for business intelligence, visualization, self-service, enterprise, application performance, and finance-related purposes.
While reporting tools are often considered synonymous with business intelligence software, there is a difference between them. Reporting tools are a component of a business intelligence suite, while business intelligence software includes various categories of tools. The primary difference lies in their ability to correlate data.
[Related article: CRM Reporting: Essential Types & How to Create Them]
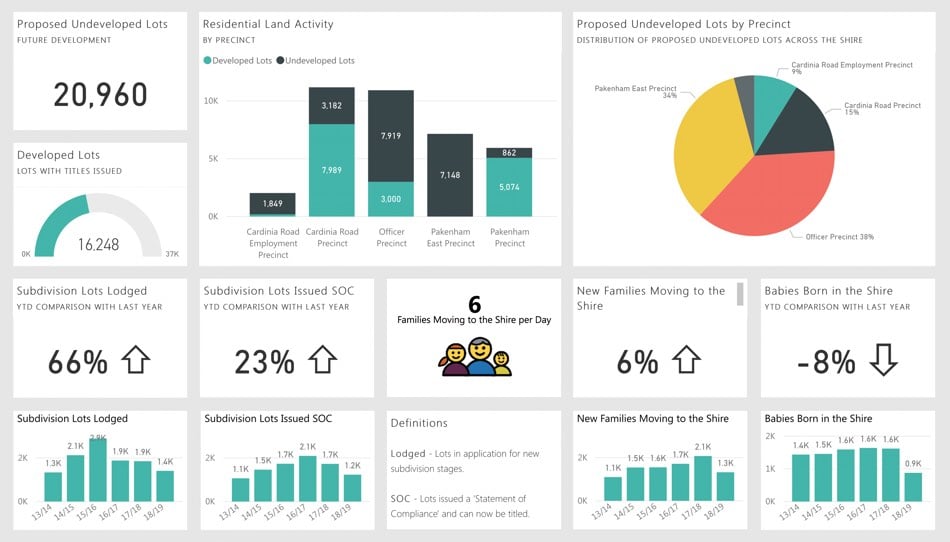
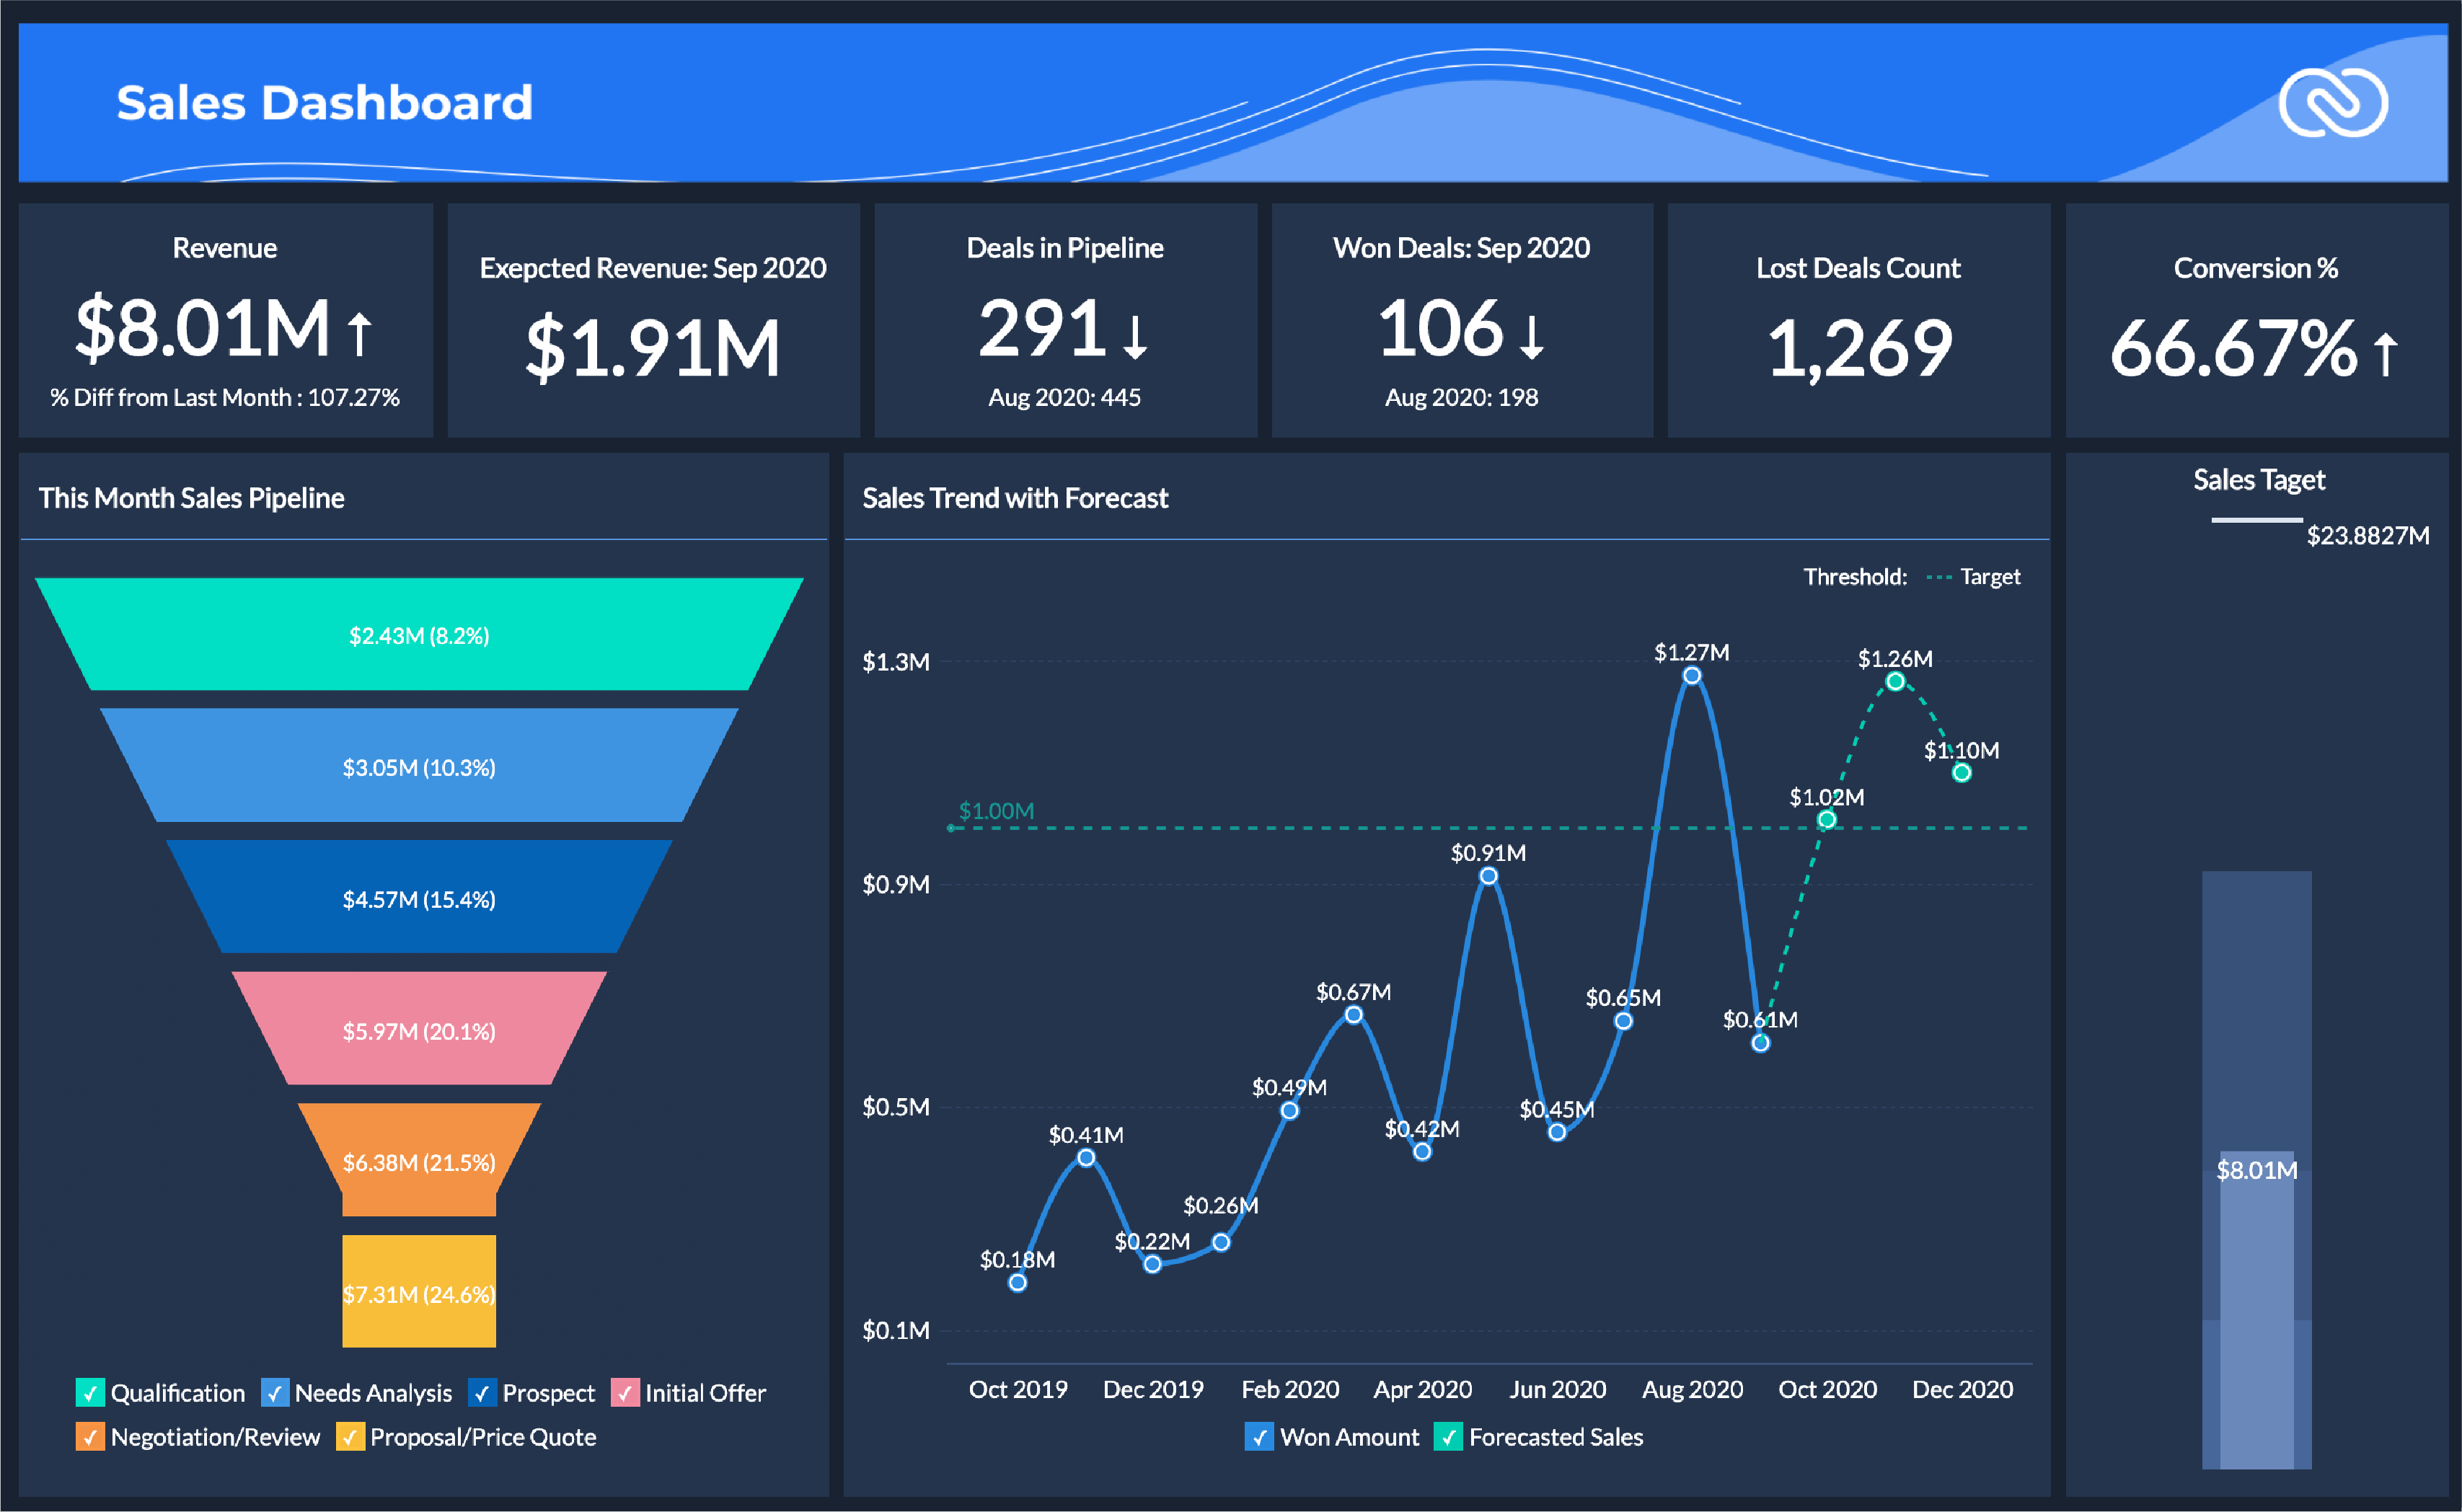
You can also pay attention to these well-known CRM systems that offer features for forecasting future sales trends and predicting customer behavior based on historical data, helping businesses make proactive decisions and anticipate market changes:
-Mar-27-2024-01-30-18-9329-PM.png)
-Mar-27-2024-01-01-45-5252-PM.png)

-Mar-27-2024-01-30-16-9529-PM.png)
What features should reporting tools have?
When selecting the best reporting tool, it's essential to consider several key features to ensure it meets your project needs effectively. Here's what to look for:
Data Visualization
Choose reporting tools that offer data visualization capabilities to transform raw data into engaging visuals, such as graphs and interactive dashboards. These visuals facilitate the right interpretation of key performance indicators (KPIs).
Analytics
Opt for tools that provide analytics features, allowing you to access real-time data for accurate insights. This enables better forecasting and data-driven decision-making, even when dealing with multiple data sources.
[Related article: 7 Best HR Analytics Software for 2024]
Collaboration
Look for reporting tools that facilitate easy sharing of reports with multiple stakeholders. Additionally, prioritize tools with intuitive interfaces that make it simple for anyone to understand the data presented in the reports.
Versatility
Seek out custom reporting software that offers versatility, catering to a wide range of reporting needs. Whether it's financial reporting, SEO marketing reports, or project management, choose tools that can handle various types of reporting tasks efficiently.
By prioritizing these features, you can find custom reporting tools that blend project management with interactive reports and data visualizations, allowing you to make informed business decisions and drive success in your projects.
How to choose the best reporting tool for your needs?
Choosing the best reporting tool for your needs involves considering several factors to ensure it aligns with your specific requirements and objectives. Here are some steps to help you make the right decision:
- Define your requirements: Start by clearly defining what you need the reporting tool to accomplish. Identify the types of reports you need, the data sources involved, and the level of customization required.
- Consider data sources: Assess the data sources you'll be using for reporting. Ensure that the reporting tool can integrate with these sources effectively to access the necessary data.
- Evaluate ease of use: Look for a reporting tool that is user-friendly and intuitive, especially if you have team members with varying levels of technical expertise. A tool with a drag-and-drop interface or pre-built templates can simplify the reporting process.
- Review customization options: Determine the level of customization you require for your reports. Choose a tool that offers flexibility in designing and formatting reports to meet your specific needs.
- Assess visualization capabilities: Consider the visualization options available in the reporting tool. Look for features such as interactive dashboards, charts, graphs, and maps that can help you present data in a visually appealing and informative way.
- Ensure scalability: Choose a reporting tool that can scale with your business as your reporting needs evolve over time. It should handle larger datasets and accommodate additional users without sacrificing performance.
- Check compatibility: Verify that the reporting tool is compatible with your existing software infrastructure, including your CRM system, databases, and other applications. Seamless integration will facilitate data transfer and streamline the reporting process.
- Review support and training: Consider the level of support and training offered by the reporting tool provider. Look for resources such as documentation, tutorials, and customer support channels to assist you in using the tool effectively.
- Evaluate cost: Compare the pricing plans of different reporting tools and consider your budget constraints. Pay attention to any additional costs for customization, training, or support services.
- Seek feedback and reviews: Research user reviews and seek recommendations from peers or industry experts who have experience with the reporting tools you're considering. Their insights can provide valuable guidance in making your decision.
[Related article: How to Choose a CRM System: Checklist with 6 Tips]
What are the three types of reporting tools?
Top-Rated Reporting Tools:
Hiver
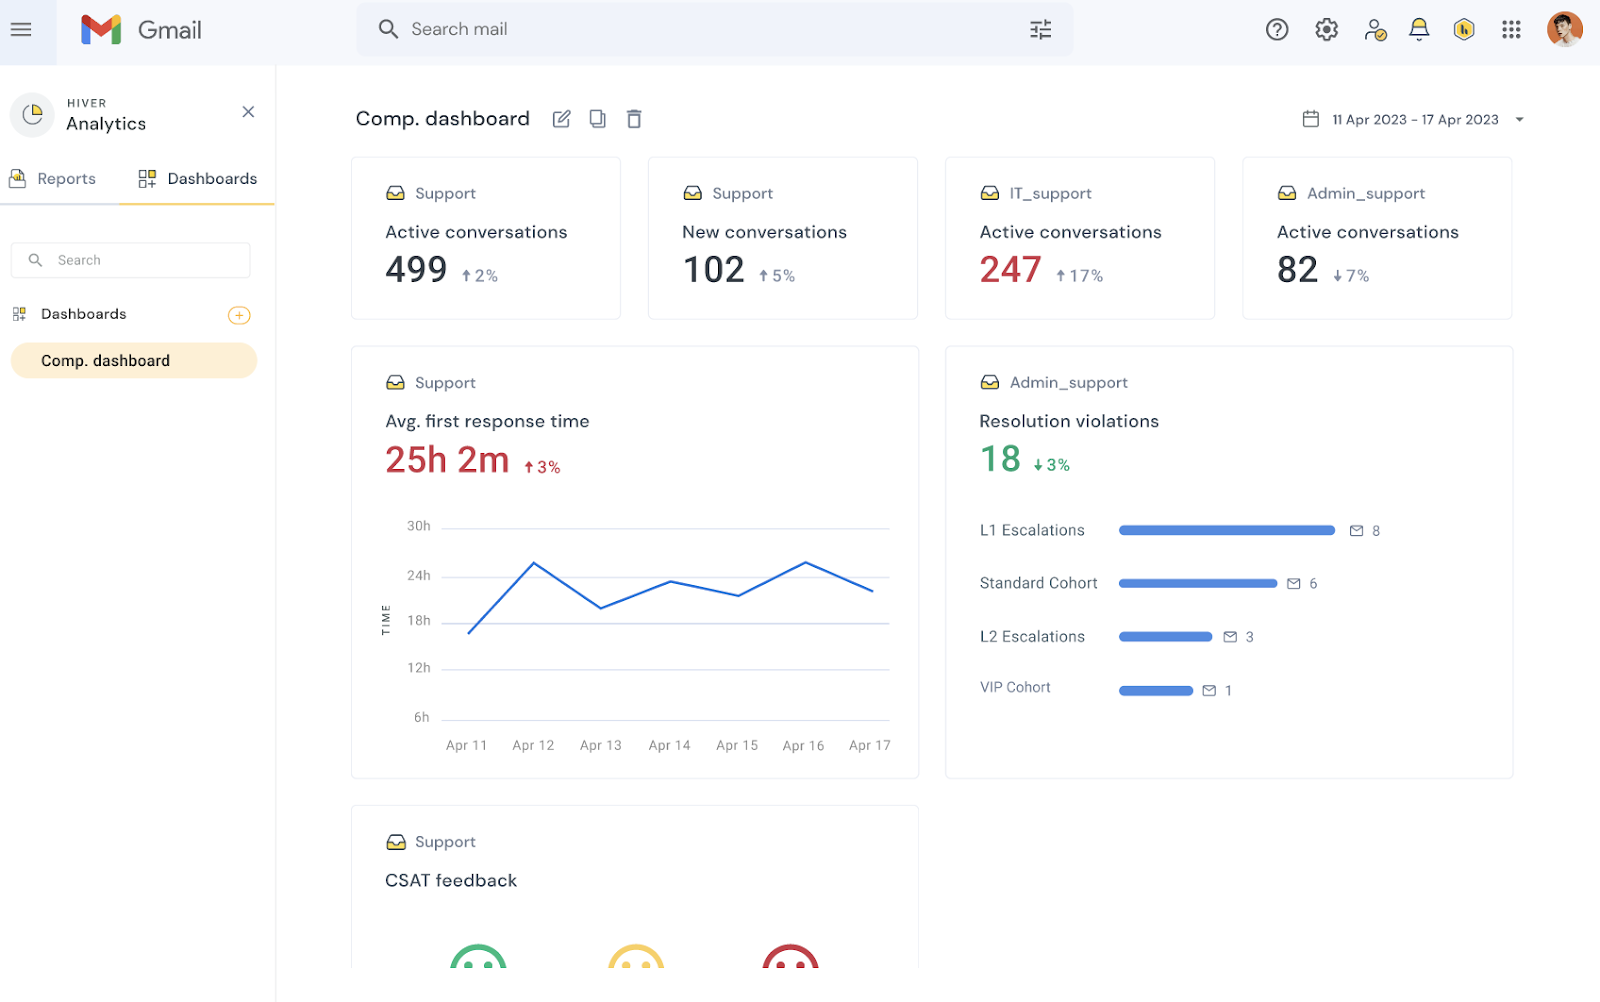
Hiver is a comprehensive custom reporting tool designed to streamline collaboration and enhance productivity within teams. With its intuitive interface and robust features, Hiver empowers users to create customized reports, track performance metrics, and gain actionable insights to drive business success.
Key Features:
- Custom Reporting: Hiver allows users to create tailored reports to track key performance indicators (KPIs) and monitor team productivity effectively.
- Automated Leadership Reports: You can pull instant reports or schedule reports for the weekly, monthly, or annual team and business effectiveness.
- Dynamic Dashboards: Create dashboards to monitor real-time performance data across shared inboxes and team members.
- Shared Inbox: With Hiver's shared inbox functionality, teams can collaborate seamlessly on emails, assign tasks, and track progress directly within their email platform.
- Workflow Automation: Hiver offers automation features to streamline repetitive tasks, such as email routing, assignment, and follow-up, enabling teams to focus on high-value activities.
- Analytics and Insights: Hiver provides advanced analytics and reporting capabilities, allowing users to analyze email trends, measure team performance, and make data-driven decisions.
- Integration: Hiver integrates with popular third-party tools and platforms, such as CRM systems and project management software, to facilitate seamless workflow integration and data synchronization.
Pros:
- Hiver has an intuitive and user-friendly UI, allowing teams to quickly find and successfully use its features.
- The analytics and reporting tools provide important insights into team performance and email data, allowing you to make more informed decisions.
- The shared inbox feature fosters collaboration and transparency among team members, improving communication and task management.
- Hiver's automation capabilities help streamline workflow processes, reducing manual effort and increasing efficiency.
Cons:
- While Hiver offers various pricing plans, some advanced features may only be available in higher-tier plans.
Pricing:
- LITE: $15 per user per month, billed annually
- PRO: $39 per user per month, billed annually
- ELITE: $59 per user per month, billed annually
HubSpot Marketing Analytics
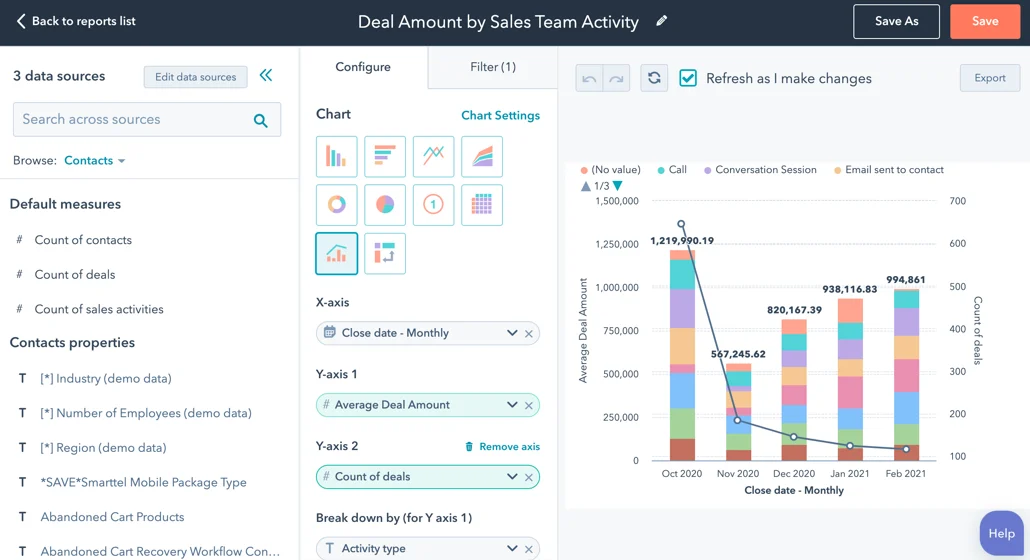
HubSpot Marketing Analytics provides a centralized platform where you can evaluate the effectiveness of your entire marketing funnel using powerful built-in analytics, reports, and dashboards. With this top reporting software, you have all the tools to make informed decisions and enhance your marketing strategies.
Key Features:
- Comprehensive Funnel Measurement: HubSpot allows you to assess your marketing funnel's performance from the initial acquisition stage to the final conversion, providing insights into each step of the customer journey.
- Customer Tracking: You can monitor the progress of individual customers, from anonymous website visitors to loyal clients, gaining valuable insights into customer behavior and interactions.
- Trend Identification: By analyzing your data over time, HubSpot helps you identify significant trends and patterns, empowering you to adapt your strategies.
- Website Performance Analysis: HubSpot offers key website metrics to evaluate site performance, allowing you to pinpoint areas for improvement and enhance the overall user experience.
- Channel-Specific Reports: Detailed reports are available for each marketing channel, providing in-depth insights into the performance of various channels.
Pros:
- The ability to track individual customers throughout their journey enables personalized marketing strategies and fosters customer loyalty.
- As an all-in-one inbound marketing software, HubSpot consolidates a wide range of marketing tools and functionalities into a single platform, streamlining workflow and increasing productivity.
Cons:
- While HubSpot offers extensive features, subscription plans may be costly for some businesses, particularly smaller enterprises or startups with limited budgets.
Pricing:
- Free plan
- Starter: $20 per month
- Professional: $890 per month
- Enterprise: $3,600 per month
ClickUp
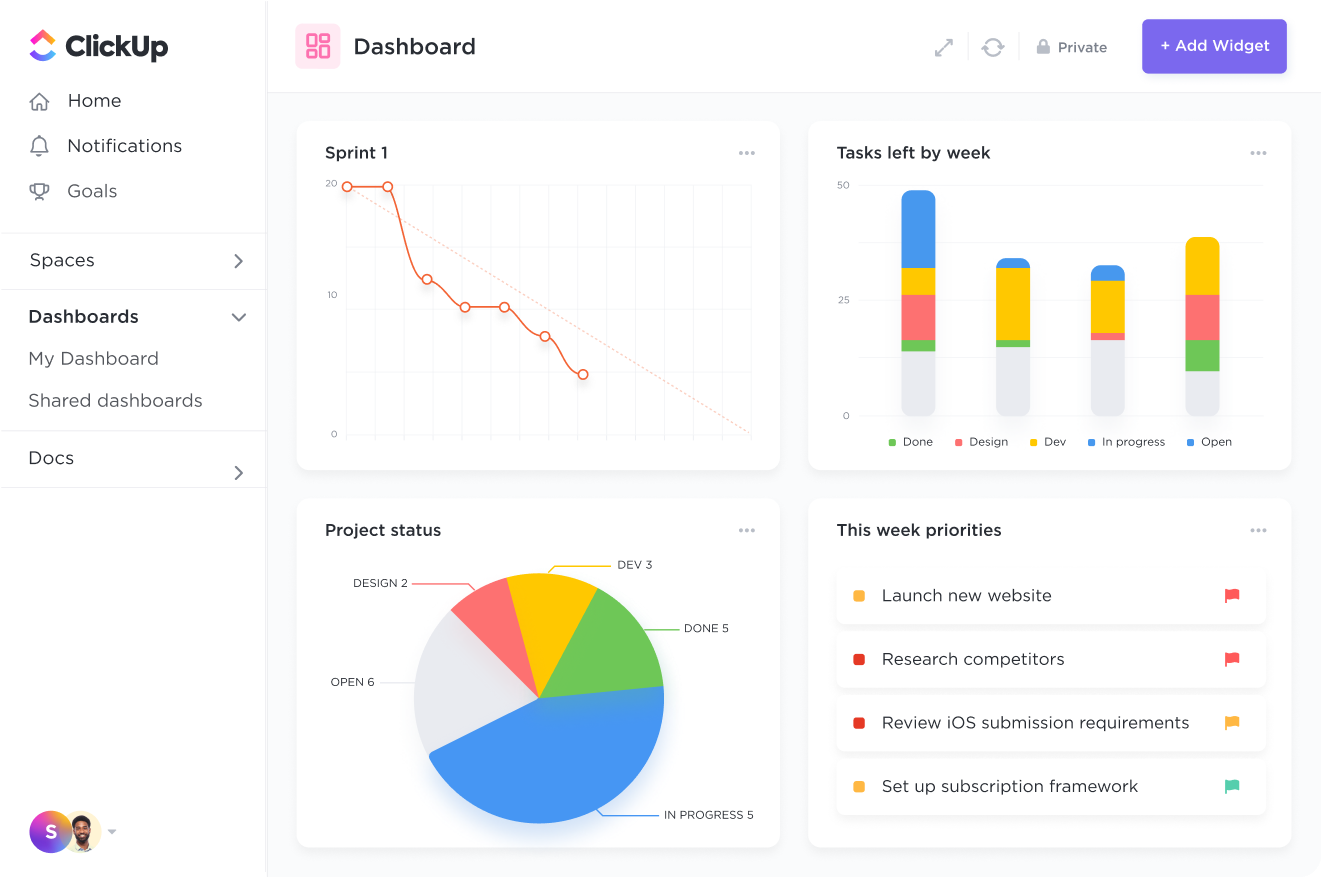
ClickUp is an excellent reporting tool for business management, providing a comprehensive solution for tracking and optimizing numerous aspects of your business. With ClickUp, you can set quarterly goals, monitor employee time, and gain valuable insights into resource management and workload analysis—all from a single, user-friendly dashboard.
Key Features:
- Workload & Box View: ClickUp's innovative Team View allows you to rethink resource management by visualizing your team's workload. Identify potential burnout risks and allocate tasks more efficiently.
- Milestones: Transform tasks into Milestones to track progress with a sleek Gantt-style chart, providing a clear visual representation of your achievements.
- Integrations: Seamlessly integrate ClickUp with other platforms such as Tableau to pull reports and streamline your reporting process.
- ClickUp Goals: Set and track goals within ClickUp, complete with timelines, targets, and progress tracking features to keep your team focused and motivated.
- Pulse: Get a quick overview of team activity with Pulse reports, showing who's online and what tasks they're working on in real-time.
Pros:
- This report generation tool offers a wide range of reporting features to help you identify strengths and streamline processes, resulting in tighter teams and improved productivity.
- Despite its powerful capabilities, ClickUp has a straightforward interface that allows users to navigate and use its functions easily.
- Pulse reports provide valuable real-time insights into team activity, allowing for proactive management and decision-making.
Cons:
- While ClickUp offers a free version, some features are only accessible to paid subscribers, which may limit functionality for users on a budget.
Pricing:
- Free plan
- Unlimited: $7 per user per month, billed annually
- Business: $12 per user per month, billed annually
- Enterprise: contact the vendor
Databox
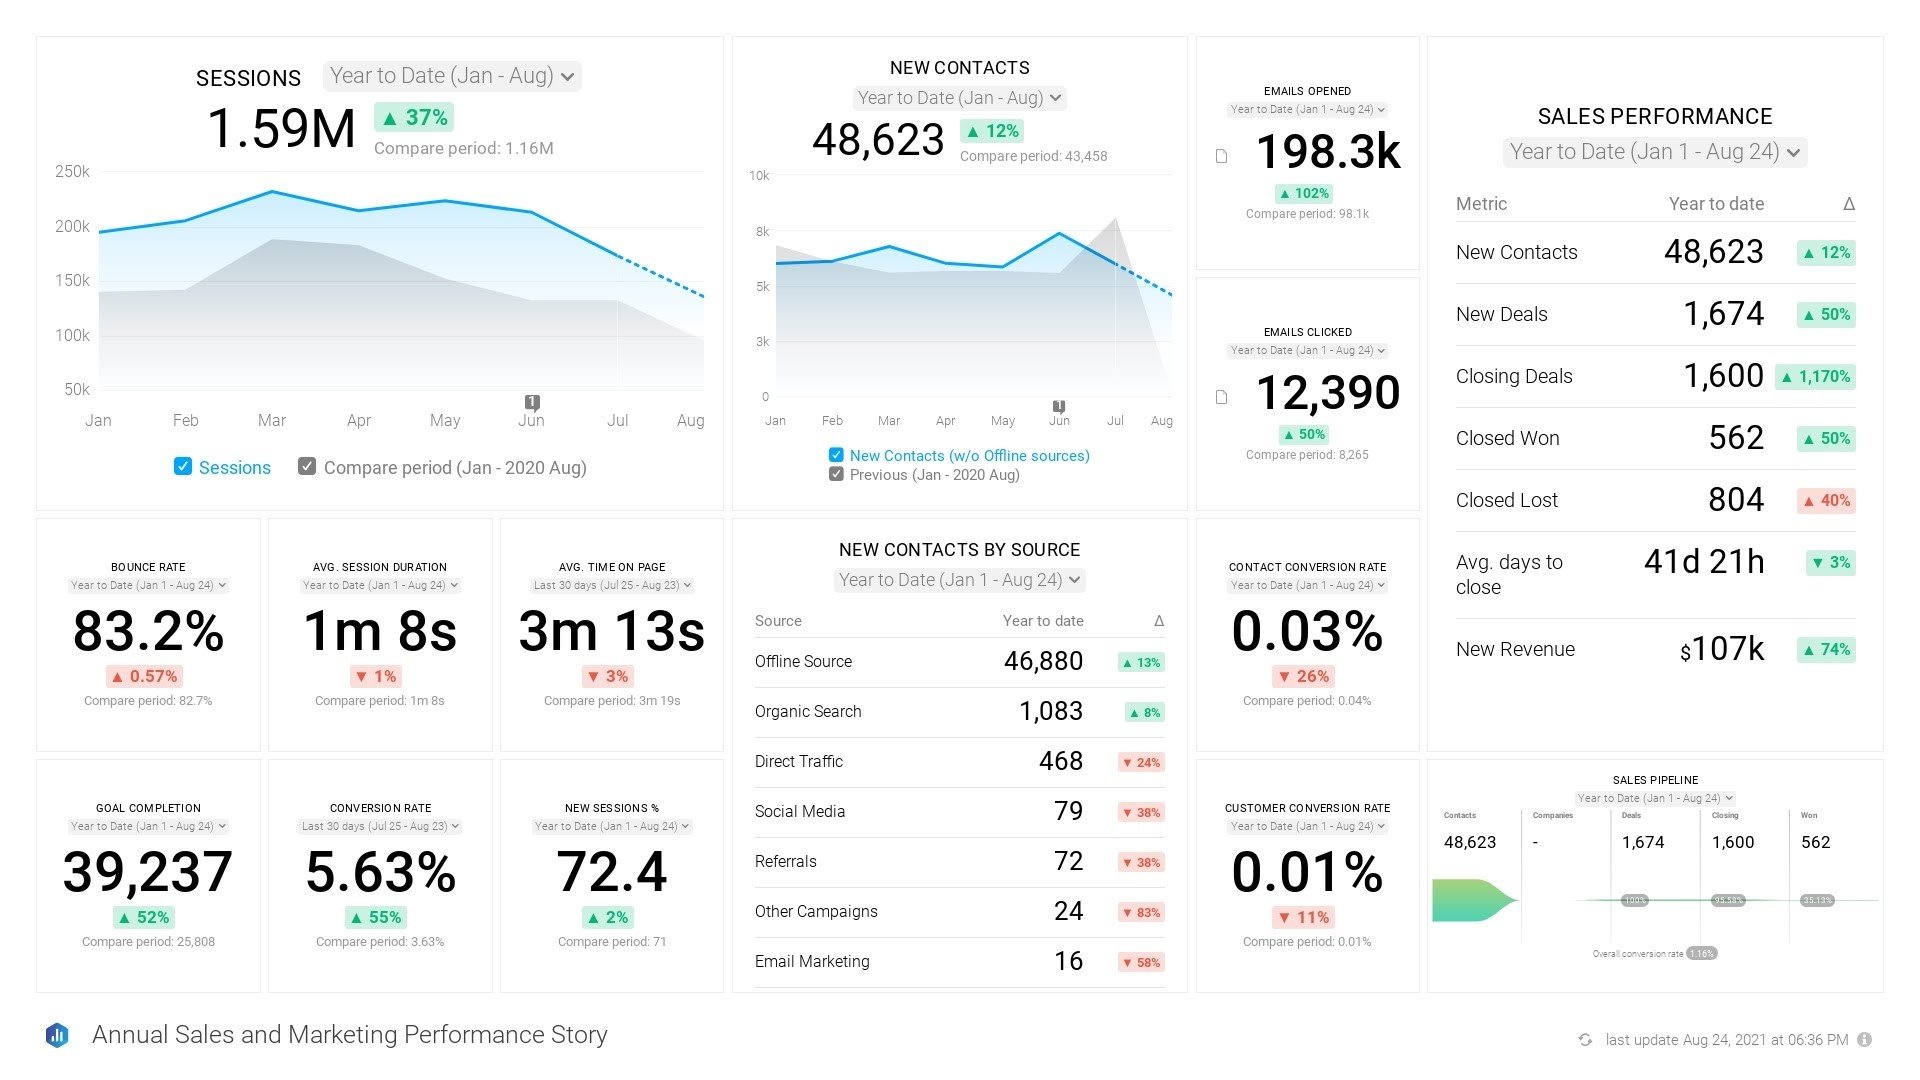
Databox is a business analytics platform that enables users to easily gather, visualize, and understand key performance indicators (KPIs) from various data sources in one centralized location. It offers a streamlined approach to data analysis, allowing businesses to make data-driven decisions efficiently.
Key features:
- Data integration: Databox seamlessly integrates with a wide range of data sources including Google Analytics, Salesforce, HubSpot, Facebook Ads, and many more, enabling users to consolidate all their data in one place.
- Customizable dashboards: Users can create personalized dashboards tailored to their specific needs, with drag-and-drop functionality to arrange widgets displaying various metrics and visualizations.
- Real-time data updates: Databox provides real-time updates on performance metrics, ensuring that users have access to the most current information to make timely decisions.
- Goal tracking: Users can set and track goals for their KPIs, allowing them to monitor progress and take action when performance deviates from targets.
- Alerts and notifications: Databox offers customizable alerts and notifications to notify users when certain metrics reach predefined thresholds, enabling proactive management of performance.
- Mobile accessibility: With a mobile app available for iOS and Android devices, users can access their dashboards and monitor key metrics on the go.
Pros:
- Databox boasts a user-friendly design that simplifies the data analysis process.
With over 70 Databox integrations and 2000+ third-party integrations, users can seamlessly gather data from various sources. - You don't need coding skills to utilize Databox effectively, making it accessible to all skill levels.
Whether you're on desktop, mobile, TV, or even Apple Watch, Databox ensures you can access your data anytime, anywhere. - Customize your dashboards effortlessly with Databox's drag-and-drop feature, allowing for easy arrangement of metrics.
- Databox offers affordable pricing plans, making advanced analytics accessible to businesses of all sizes.
Cons:
- While Databox provides regular updates via email, some users may find the frequency overwhelming.
- Certain integrations may pose difficulties when optimizing for your specific needs, requiring additional effort and time.
- Setting up Databox may require time to configure integrations and customize dashboards to your preferences.
Pricing:
- Free plan for up to 3 users
- Starter: $47 per month (5 users), billed annually
- Professional: $135 per month (15 users), billed annually
- Growth: $319 per month (unlimited users), billed annually
- Premium: $799 per month (unlimited users), billed annually

There’s no need. Fireberry is built to be simple and intuitive for all users. This lets you easily and quickly set up and make changes to any and all customization settings, including but not limited to sharing settings, automations, pages, objects, and fields.
Yes. Fireberry can integrate with many third-party apps, and has a comprehensive documentation to help technology oriented users with the integration process.
Fireberry’s unique customization abilities in every part of the system allow its use by many different industries, such as real estate, healthcare, education, and so much more. You can also collaborate with one of our partners to help you set up and optimize the system.
Business Intelligence Tools (BI):
Microsoft Power BI
Microsoft Power BI is a comprehensive business analytics solution that provides customers with interactive visualizations and advanced business intelligence features. With a user-friendly interface, it enables end-users to effortlessly create reports and dashboards. The system integrates with diverse data sources, enabling users to connect, analyze, and share insights across their organization.
Key Features:
- Data Connectivity: Power BI supports a wide range of data connectors, facilitating the import of data from various sources, including Excel, databases, and both cloud-based and on-premises data sources.
- Interactive Dashboards: Users can craft interactive and customizable dashboards with real-time updates, allowing for dynamic data exploration and visualization.
- Natural Language Queries: Power BI simplifies the querying process by enabling users to ask questions in natural language, generating visualizations based on the queries, and enhancing user-friendliness.
- Powerful Data Modeling: The platform offers robust data modeling capabilities, empowering users to define relationships and create intricate data models for in-depth analysis.
- Integration with Microsoft Tools: Power BI seamlessly integrates with various Microsoft products such as Excel, Azure, and SQL Server, providing a comprehensive business analytics solution within the Microsoft ecosystem.
Pros:
- Power BI has an easy-to-use interface that can be used by people of all technical skill levels.
- The tool supports numerous data connectors, simplifying integration with diverse data sources.
- Users can develop real-time dashboards, facilitating continuous monitoring and enabling data-driven decisions on the fly.
- Power BI facilitates easy sharing and collaboration on reports and dashboards, promoting teamwork and knowledge sharing.
- Benefit from a large and active user community, providing ample resources, forums, and support.
Cons:
- While Power BI has a free version, advanced capabilities and larger data capacity may incur additional charges, potentially limiting budgets for some businesses.
- Using advanced features may require a learning curve for users, particularly those new to business intelligence tools.
- Power BI's deep integration with Microsoft products may pose difficulties for firms using other platforms or operating systems.
Pricing:
- Free plan
- Power BI Pro: $10 per user per month
- Power BI Premium: $20 per user per month
Tableau
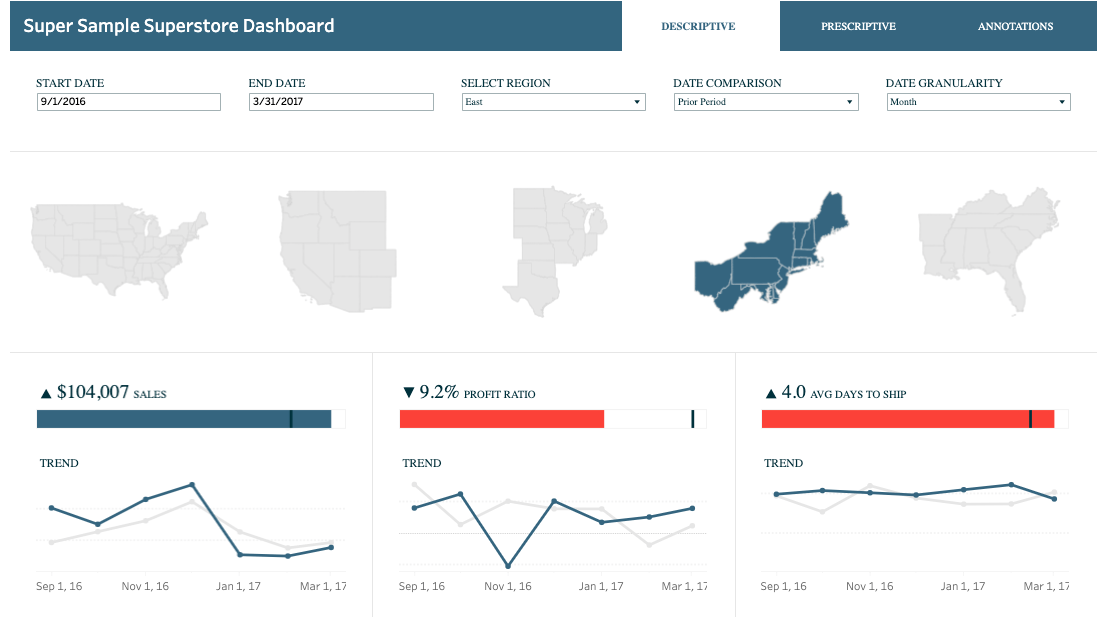
Tableau is a robust data visualization and business intelligence tool renowned for its ability to connect, visualize, and share data effectively, driving data-driven decision-making within organizations. With its interactive and exploratory data analysis features, Tableau stands out as a top choice for organizations seeking powerful reporting and visualization capabilities.
Key Features:
- Visual Analytics: Tableau excels in visual analytics, empowering users to create interactive and customizable visualizations to delve deep into their data and gain valuable insights.
- Data Blending: The tool seamlessly blends data from multiple sources, offering a comprehensive view of the data and supporting complex analyses.
- Real-Time Data Interaction: Users can work with data in real time, which allows for dynamic exploration and analysis of changing datasets.
- Dashboard Creation: Tableau provides a user-friendly interface for creating intuitive and interactive dashboards, which can be effortlessly shared across the organization.
- Scalability: Tableau is scalable, catering to the needs of both small and large teams, with options for on-premises or cloud deployment.
Pros:
- Tableau's user-friendly interface enables users to create sophisticated visualizations without requiring extensive technical expertise.
- It provides a variety of visualization options, allowing users to present data in engaging and relevant ways.
- Tableau has an active community, complete with forums, user groups, and a wealth of online learning and assistance tools.
- This report platform seamlessly integrates with diverse data sources, including spreadsheets, databases, and cloud services, providing flexibility and accessibility.
- Tableau supports mobile accessibility, allowing users to connect to and work with their reports and dashboards from a variety of devices.
Cons:
- Tableau's licensing costs may be relatively high, which could be a consideration for smaller organizations.
- While the basics are simple to understand, mastering advanced functions may take some effort and training.
- Tableau's ETL capabilities are limited compared to dedicated ETL solutions, which may be a challenge for enterprises with complicated data transformation requirements.
Pricing:
- Tableau Creator: $75 per user per month, billed annually
- Tableau Explorer: $42 per user per month, billed annually
- Tableau Viewer: $15 per user per month, billed annually
- Tableau Enterprise: contact the vendor
Zoho Analytics
Zoho Analytics is a self-service business intelligence and analytics solution that empowers users to delve into their business data and craft insightful reports and dashboards effortlessly. With its capability to handle vast datasets, Zoho Analytics delivers impactful visualizations that simplify data interpretation.
Key Features:
- Intuitive Interface: Zoho Analytics is an easy drag-and-drop interface that allows users to easily generate reports and dashboards.
- AI-powered Assistant: With the AI-powered assistant Zia, users can receive answers to their queries in the form of insightful reports, enhancing decision-making processes.
- Data Blending: Users can blend data from diverse sources, facilitating the creation of cross-functional reports that offer comprehensive insights into business operations.
- Enhanced Collaboration: Zoho Analytics boasts enhanced collaboration features, allowing users to seamlessly share and collaborate on reports and dashboards, fostering teamwork and knowledge sharing.
- Robust Security Measures: The platform prioritizes security with robust measures including role-based access controls, ensuring data confidentiality and integrity.
Pros:
- It boasts excellent data visualization capabilities, providing a comprehensive collection of visualization tools to help business teams detect organizational trends and patterns effectively.
- The software's analytical features seamlessly integrate with other solutions such as CRM platforms, ERP systems, and more.
- With its modular and scalable architecture, the platform simplifies the development and integration of analytics into applications of any size, ensuring flexibility and adaptability to meet diverse business needs.
Cons:
- Some users may experience a steep learning curve, particularly beginners who are new to the platform, requiring additional time and resources for training.
- The free version may have limited options for customization, potentially restricting users' ability to tailor reports and dashboards to their specific needs.
Pricing:
- Free plan
Cloud:
- BASIC: €24 per month, billed annually (2 users)
- STANDARD: €48 per month, billed annually (5 users)
- PREMIUM: €115 per month, billed annually (15 users)
- ENTERPRISE: €455 per month, billed annually (50 users)
- CUSTOM: contact the vendor
Financial Reporting Tools:
QuickBooks
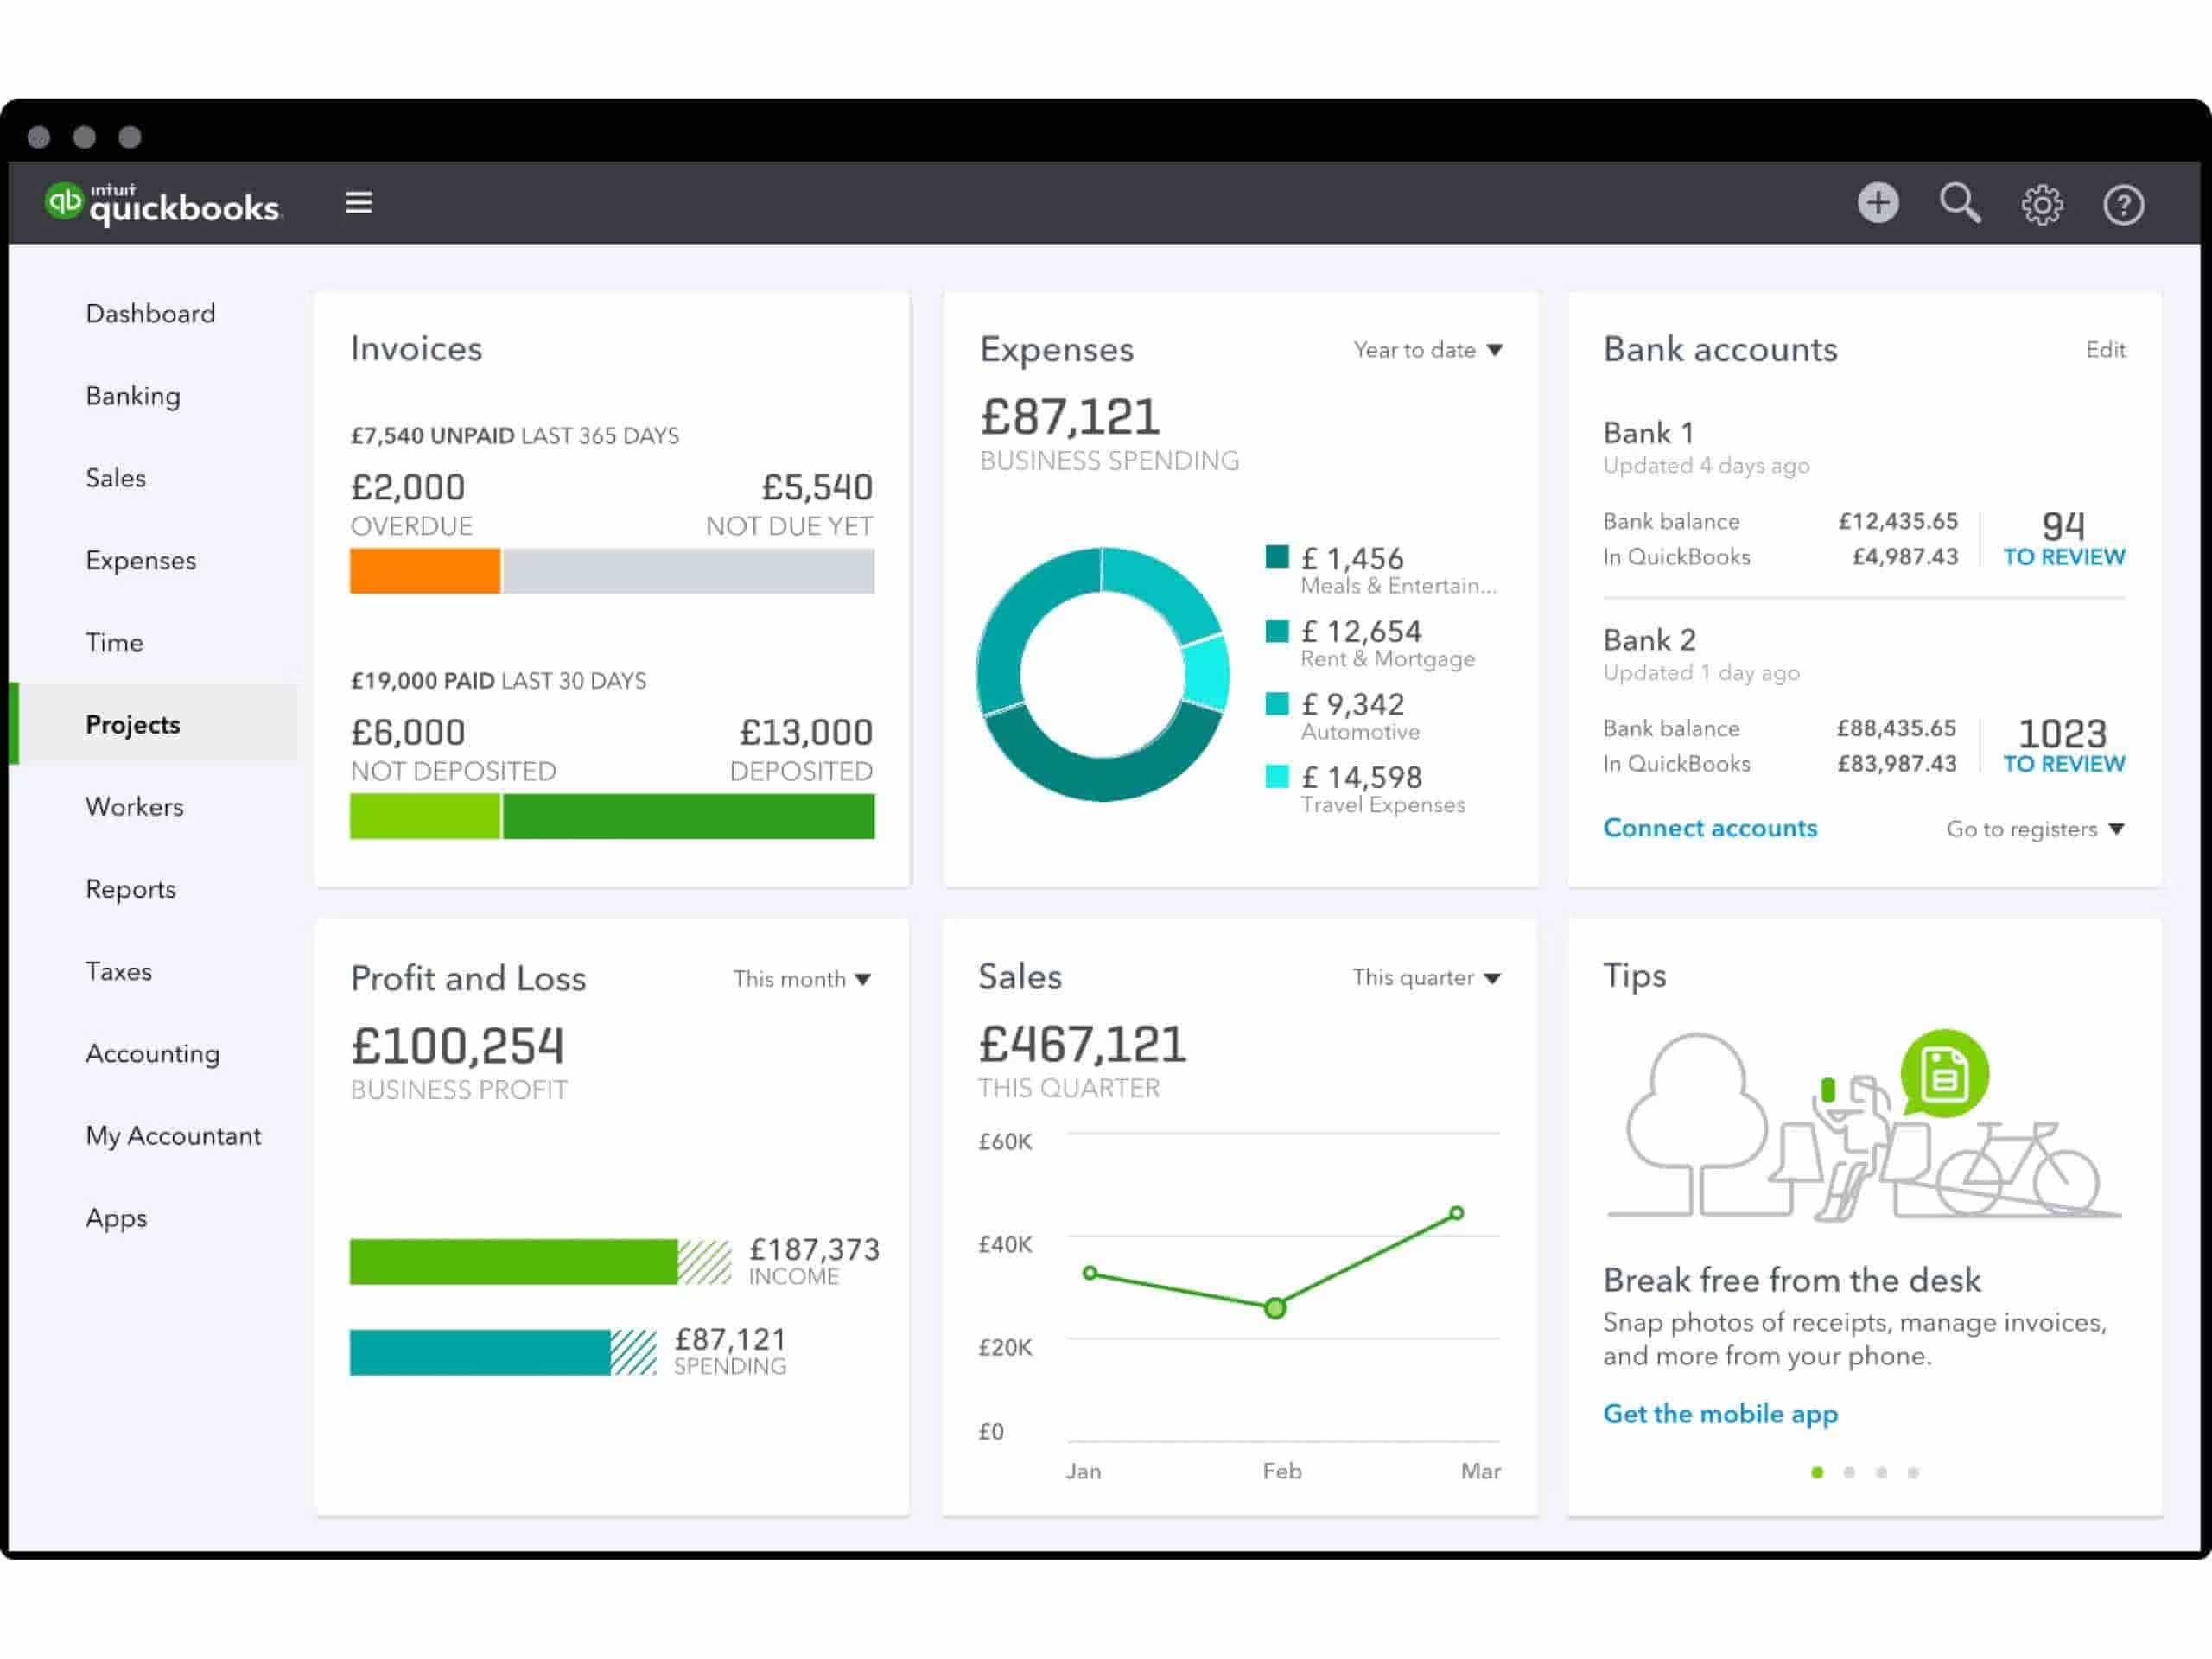
QuickBooks is a versatile accounting and report-writing software solution designed to aid businesses of all sizes in managing expenses, projects, invoices, and various financial tasks effectively.
Key features:
- Memorizable reports: QuickBooks allows users to "memorize" reports for future use, saving time on customization each time a report is generated.
- Budgeting: Users can set up budgets within QuickBooks Online and generate budget reports to compare actual performance against projected amounts.
- Customized graphs and charts: The software enables users to create personalized graphs and charts, offering visually appealing representations of data for easy understanding.
- Comparative reports: QuickBooks offers comparative reports, allowing users to analyze data from different periods and track changes in their business's financial performance over time.
Pros:
- Thorough record-keeping and comprehensive reporting capabilities, with the entry-level plan providing access to over 50 reports.
- Extensive integration options, including more than 750 third-party app integrations, along with the ability to incorporate in-house bookkeeping and payroll services.
- Access to Monday-Sunday phone support and live chat assistance across all plans, ensuring users receive timely assistance when needed.
Cons:
- Monthly subscription plans may be costlier compared to alternative solutions.
- There may be a learning curve for users when initially getting started with QuickBooks, particularly if they are new to accounting software.
Pricing:
- Simple Start: €17 per month, billed monthly
- Essentials: €25 per month, billed monthly
- Plus: €35 per month, billed monthly
[Related article: 10 Best CRM for QuickBooks Integration]
Sage Intacct
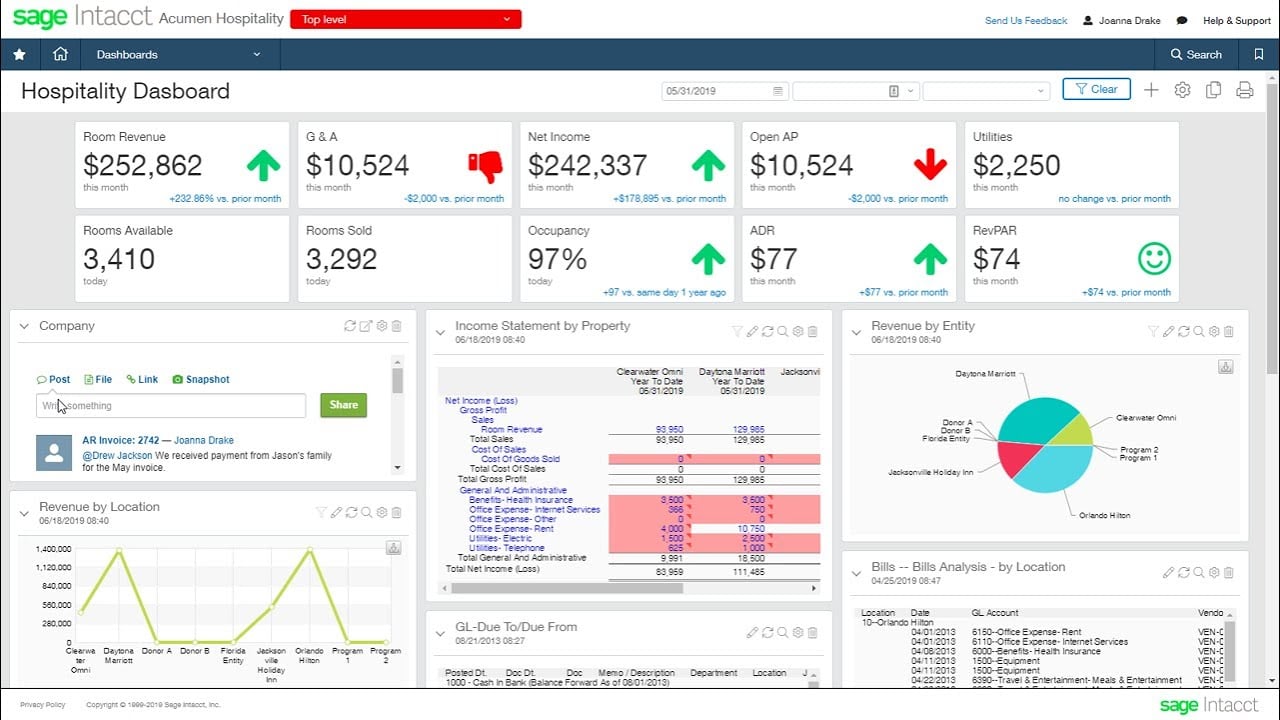
Sage Intacct is a cloud-based financial management and accounting reporting software that offers flexible analysis and real-time reporting tools.
Key Features:
- Flexible Analysis: The software provides flexible analysis tools, enabling users to customize reports and dashboards to suit the needs of various stakeholders, including investors, executives, sales, and finance departments.
- Real-Time Reporting: Sage Intacct offers real-time reporting capabilities, allowing users to quickly slice and dice financial details and access up-to-date insights.
- Customization Options: Users can dive deeper into data with custom reports, dashboards, and visualizations, tailoring the software to meet specific business requirements.
- Innovative General Ledger: Sage Intacct's innovative general ledger covers ten dimensions, capturing the business context of transactions, operational measures, and budgets, simplifying the process of analyzing real-time business performance without the need for managing complex account charts.
Pros:
- Sage Intacct's cloud-based platform ensures easy access to financial data and reports from anywhere, promoting flexibility and convenience for users.
- The software offers a range of customization options for reports and dashboards, allowing users to tailor insights to meet the needs of various stakeholders.
- With real-time reporting capabilities, users can access up-to-date insights for confident decision-making.
Cons:
- Sage Intacct doesn't offer pricing information upfront.
- Sage Intacct's innovative general ledger, while powerful, may present complexity for users accustomed to traditional accounting practices, requiring time and training to fully leverage its capabilities.
Pricing:
You should contact the vendor to get pricing details.
[Related article: Best Financial Reporting Software in 2024]
Host Analytics
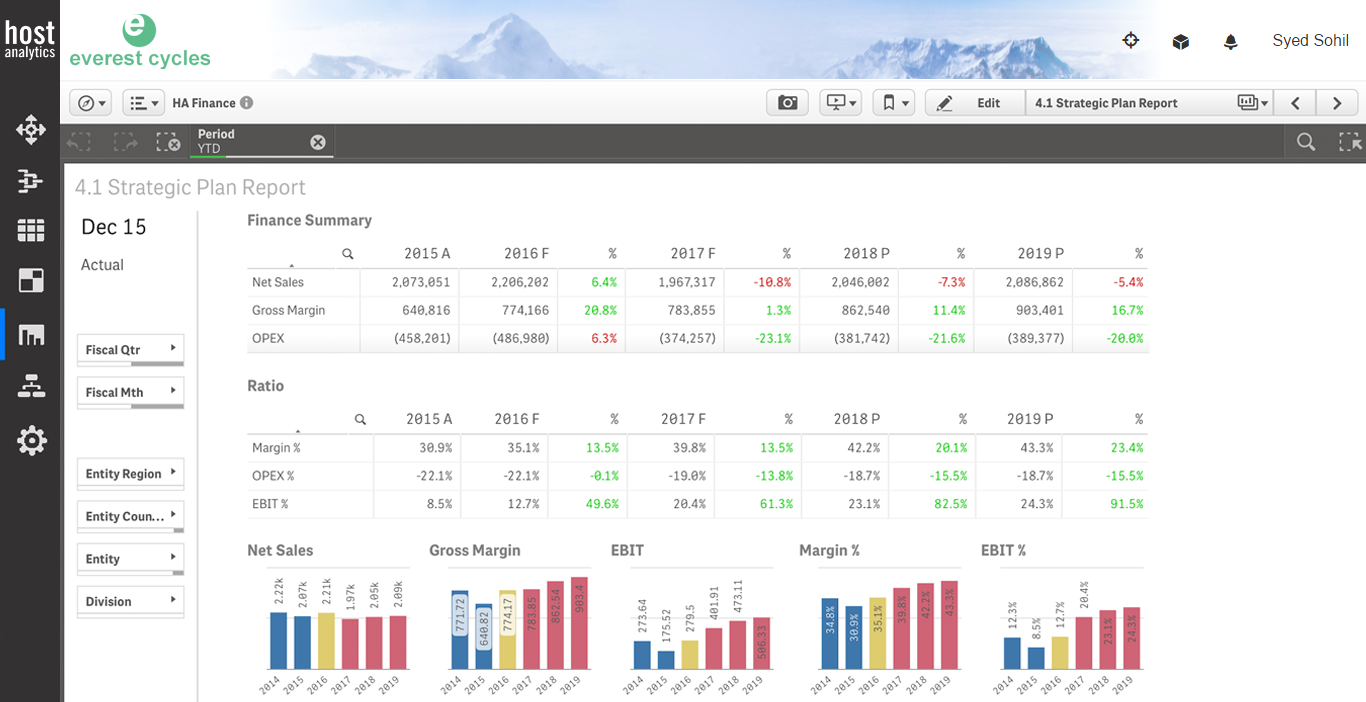
Host Analytics is a cloud-based financial planning and analysis system tailored for budgeting, planning, reporting, forecasting, and more.
Key Features:
- Advanced Reporting: The platform offers advanced formatting capabilities to produce presentation-quality financial and management reports efficiently.
- Flexible Ad-Hoc Analysis: Host Analytics provides flexible ad-hoc analysis features, allowing users to drill into data with a simple point-and-click interface to uncover in-depth insights.
- Data Security: Host Analytics prioritizes data security and integrity by leveraging the Planful platform, ensuring a secure environment with full audit trail capabilities.
Pros:
- Host Analytics ensures accurate and up-to-date reporting by integrating modeling and PCR processes, enhancing the reliability of financial insights.
- Being cloud-based, Host Analytics offers users the flexibility to access financial data and reports from any location with an internet connection.
- Excel reports are accessible from anywhere, allowing users to easily view vital financial data.
Cons:
- One of the most common complaints is the implementation procedure. In some circumstances, implementation required the hiring of third-party migration specialists.
- Users may experience a learning curve when first using Host Analytics, particularly when navigating its advanced features and capabilities.
Pricing:
You should contact the vendor to get pricing details.
Marketing Reporting Tools:
Google Analytics
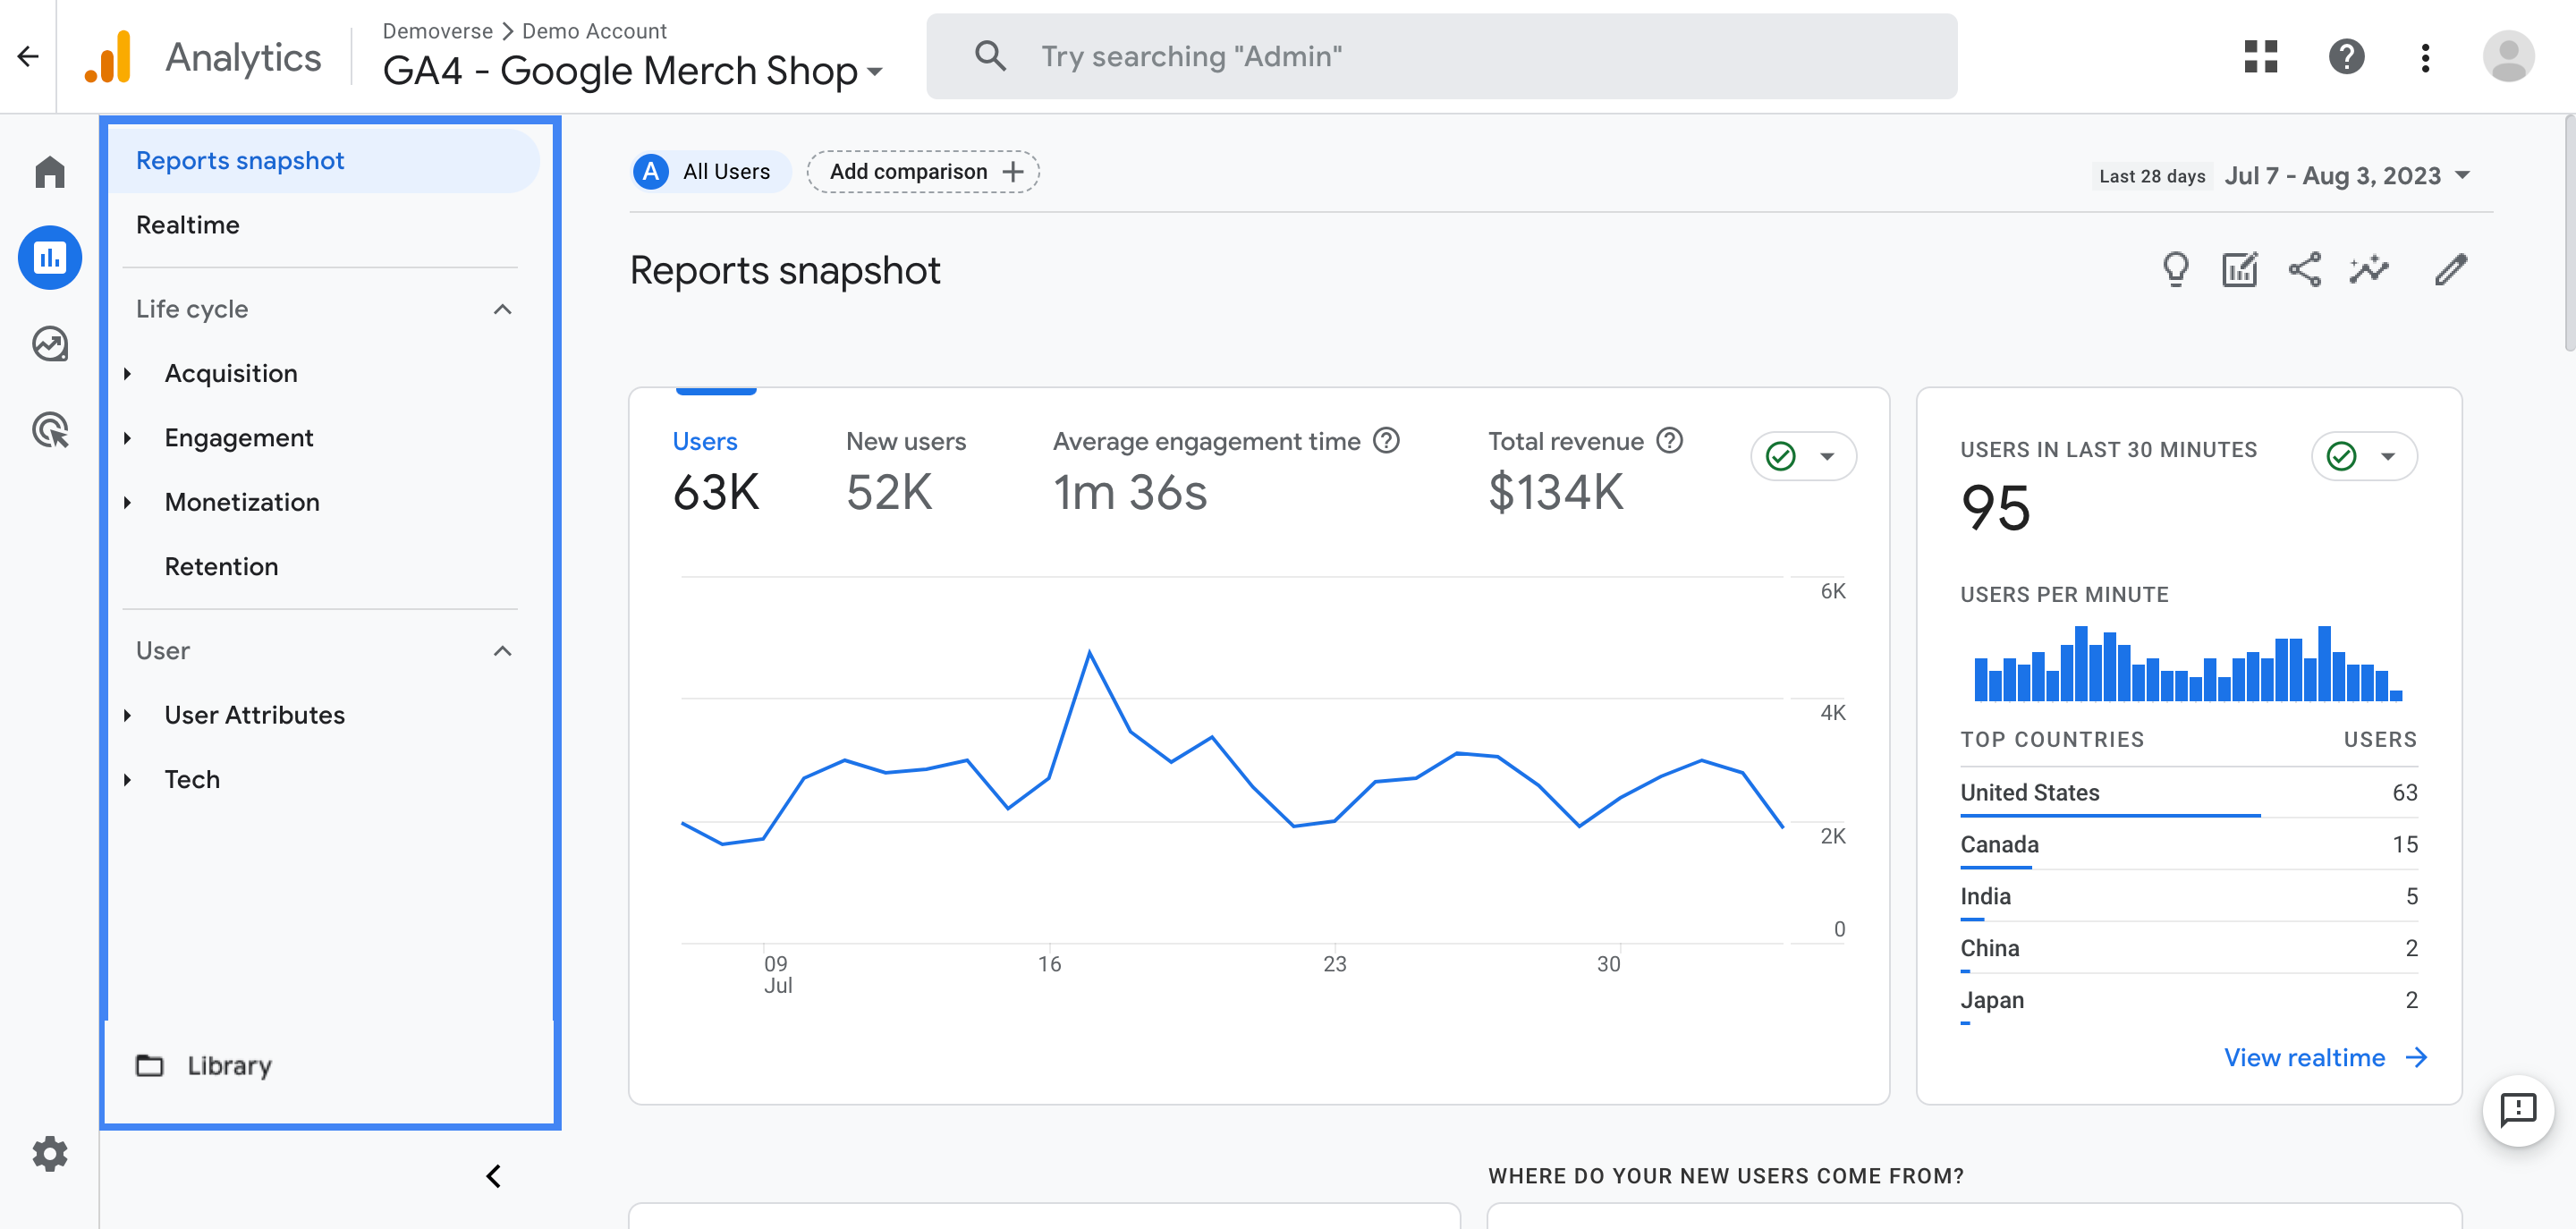
Google Analytics is one of the most robust web-based reporting software tools, designed to track user behavior in digital marketing efforts.
Key Features:
- Comprehensive Tracking: Google Analytics allows users to monitor various aspects of campaign performance, including traffic acquisitions, referrals, and user interactions, providing valuable insights for optimizing content and channel strategies.
- Reporting Flexibility: Users can easily export traffic reports into formats such as Excel, PDF, and Google Sheets, as well as schedule email reports to share with team members or clients.
- Analytics Intelligence: The platform's Analytics Intelligence feature provides valuable insights and alerts users to potential issues, such as slow website loading times, helping them improve website performance.
Pros:
- Google Analytics offers a free entry-level version with robust features, making it an affordable option for businesses seeking powerful reporting capabilities.
- The intuitive interface makes it useful to users of all skill levels, allowing them to navigate and utilize the platform effectively.
Cons:
- Users may have worries regarding data privacy and security when using Google Analytics, particularly when it comes to the gathering and handling of user data.
- Customer support is only available with the paid plan.
Pricing:
Google Analytics is completely free.
TapReports
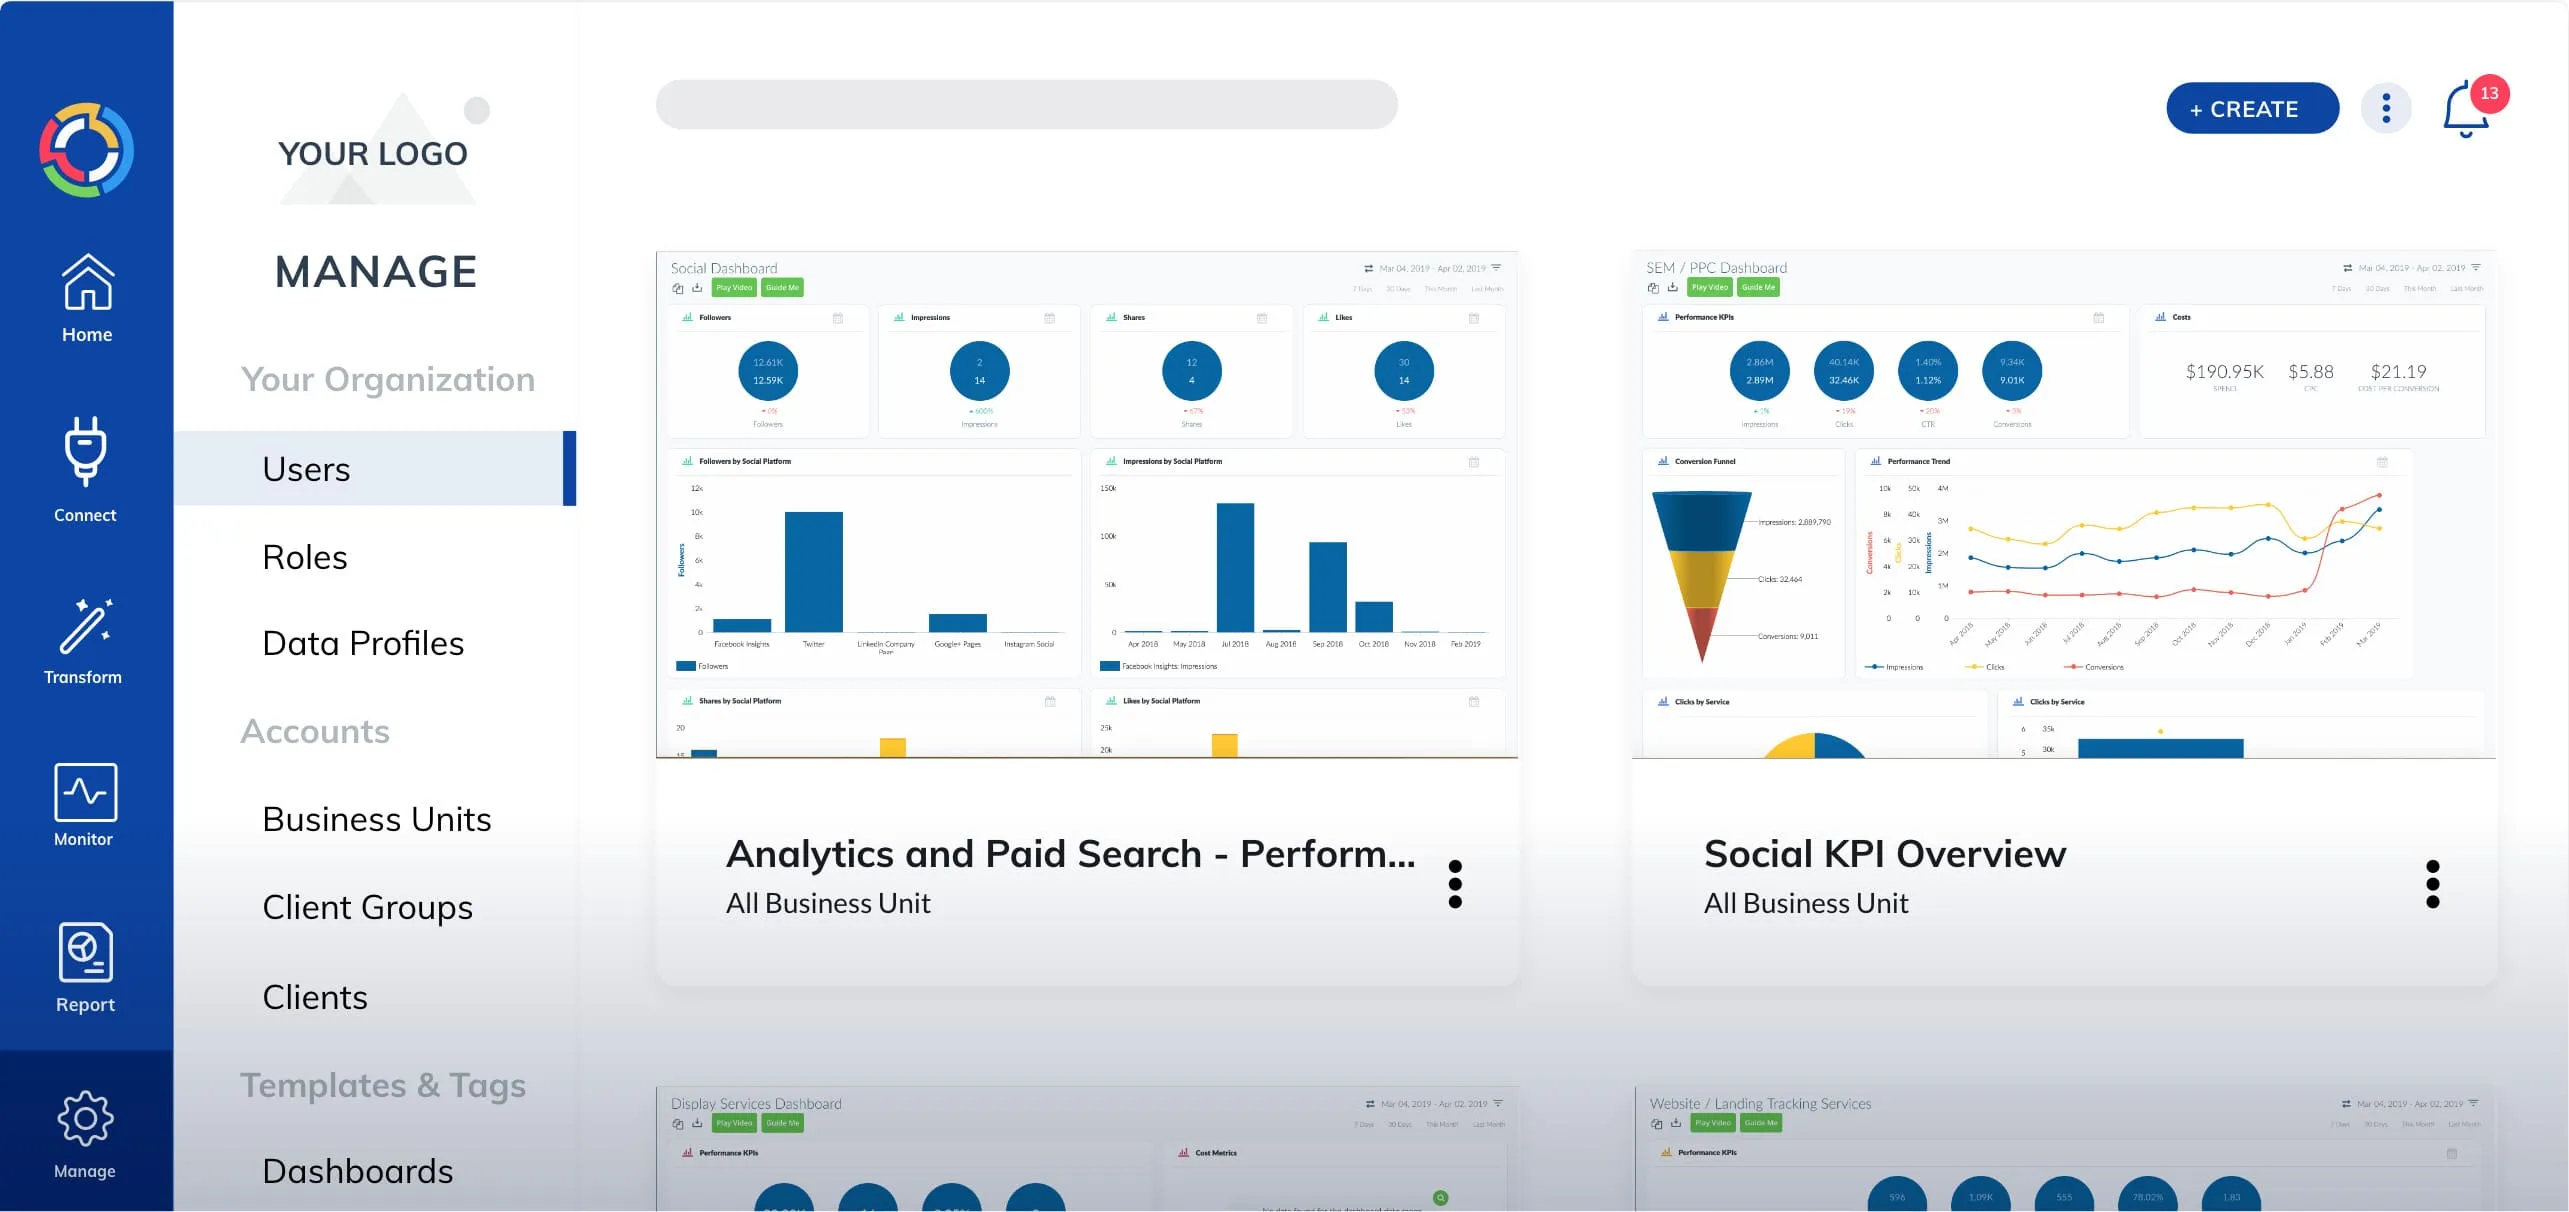
TapReports is a component of the TapClicks suite, a comprehensive set of marketing data solutions aimed at streamlining and automating the marketing process.
Key Features:
- Robust Reporting: TapReports focuses on reporting tasks, enabling agencies to efficiently manage communication with clients and generate customizable marketing reports.
- Extensive Data Connectors: With over 100 data connectors, TapReports allows users to quickly pull in data without the need for support from IT professionals, providing aggregated marketing data and omnichannel visual reports.
- Collaboration Workspace: TapReports offers an online workspace where multiple users can collaborate and work on campaigns together. This feature allows clients and marketing teams to provide input and share feedback simultaneously, facilitating campaign organization and optimization.
Pros:
- TapReports' data connectors make it easier to pull data from several sources, saving time and effort.
- The platform's online workspace promotes collaboration and teamwork, enabling clients and marketing teams to work together on campaigns.
- TapReports allows users to create customizable marketing reports tailored to the specific needs of clients, enhancing communication and transparency.
Cons:
- Users may encounter a learning curve when first using TapReports, particularly when navigating its features and customization options.
Pricing:
You should contact the vendor to get pricing details.
DashThis

DashThis is the last but not least system in our list of reporting tools, distinguishing itself from other marketing reporting software with its emphasis on visually appealing dashboards and reports.
Key Features:
- Customization Options: DashThis offers custom URLs and fully customized white-label dashboards, allowing users to tailor their reports to reflect their brand identity.
- Widget Variety: With widget chart types and advanced widget editing capabilities, users can create visually stunning dashboards that meet their specific reporting needs.
- Preset Dashboard Templates: Users can choose from over 50 preset dashboard templates to expedite the reporting process. Simply select a template, specify the reporting period, input data, and you're ready to go.
- Integration: DashThis supports integration with a wide range of platforms, including Instagram, Ahrefs, and SEMrush, enabling users to pull in data from various sources for comprehensive reporting.
Pros:
- DashThis prioritizes visually appealing dashboards and reports, making it easy for users to create professional-looking presentations without extensive design skills.
- DashThis offers users excellent customer support.
Cons:
- Sometimes some bugs occur on the interface.
- Lack of dynamic charts and graphs.
Pricing:
- INDIVIDUAL: $42 per month, billed annually
- PROFESSIONAL: $127 per month, billed annually
- BUSINESS: $246 per month, billed annually
- STANDARD: $382 per month, billed annually
Which database is best for use reporting?
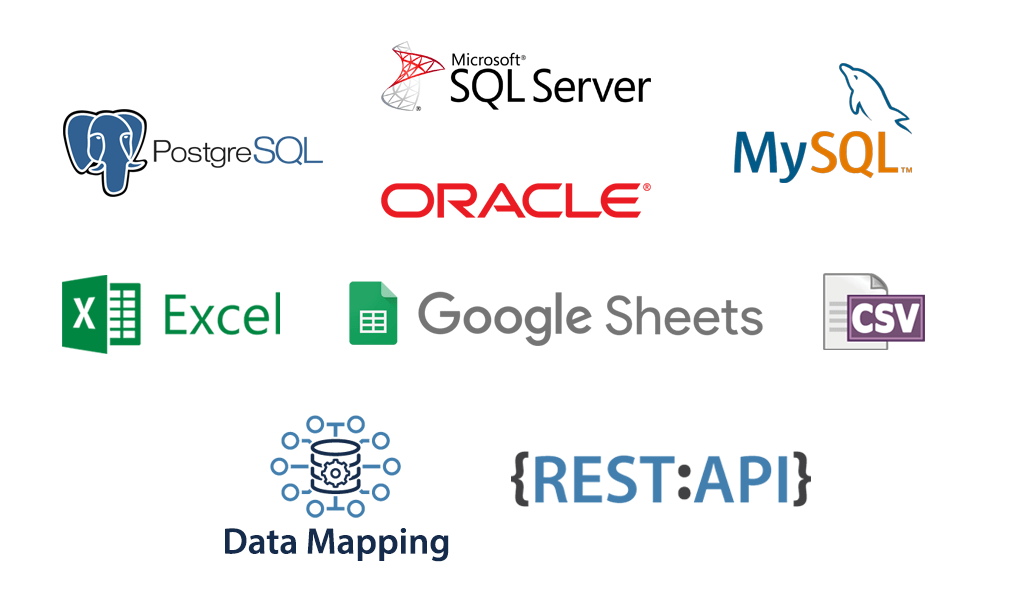
A top-notch reporting tool should seamlessly support a variety of data sources. This includes mainstream relational databases such as Oracle, SQL Server, MySQL, and more. Additionally, compatibility with Excel, TXT, or XML documents, as well as BI multidimensional databases like Essbase and SSAS, is crucial. The broader the range of supported data sources, the smoother your reporting experience will be, especially considering the complexity of enterprise data.
[Related article: CRM Database: What it is and How to Make]
What tool is best used for dashboard data insights and reporting?
Contrasting BI software with reporting tools
In terms of data analysis and presentation, there exists a plethora of Business Intelligence (BI) software with robust reporting capabilities. It's a common misconception to confuse reporting tools with BI software, but in reality, they serve distinct purposes. Essentially, reporting tools are tailored for showcasing data, whereas BI tools delve deeper into data analysis and interpretation.
Reporting tools find their niche primarily within IT departments or among report developers. Their primary function revolves around creating reports and visual representations of data like electronic invoices, processing sheets, receipts, and more, offering insights into past and present scenarios.
On the other hand, BI software caters to business professionals and data analysts. It combines 'data' and 'business understanding'. While the 'data' aspect mirrors that of reporting software, focusing on statistical analysis and data presentation, the 'business understanding' aspect delves into profound data analysis and intelligent forecasts using BI functionalities such as OLAP analysis, data mining, and others. This deeper understanding sheds light on the reasons behind existing statuses and offers strategies for enhancing future performance.
Evaluating excel against reporting tools
Despite the enduring popularity of Excel for report generation, its limitations are well-known among those frequently dealing with reports. Using Excel as a reporting tool can be cumbersome for several reasons.
Firstly, manual report generation in Excel is prone to errors and takes considerable time. Secondly, identifying issues in real-time within Excel is challenging. In contrast, reporting tools streamline data interpretation through simple queries aided by intuitive widgets. Finally, Excel's presentation options are limited compared to reporting tools. While Excel has seen enhancements in recent years, especially in its features, it still falls short in comparison to dedicated reporting tools.
Assessing the user-friendliness of the report designer
Efficiency is key when designing reports. Look for a tool with an intuitive report designer that is easy to learn and operate. Ideally, minimal coding should be required, and an Excel-based interface can significantly expedite the process. Such simplicity allows users, even those with basic Excel skills, to swiftly generate reports without relying on IT assistance.
Verifying support for elaborate reports and advanced visual effects
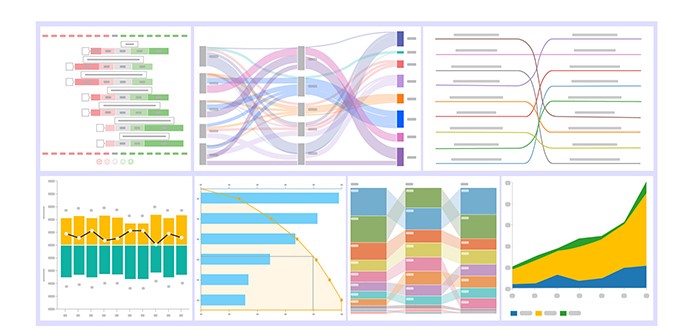
Complex reports often entail multiple sections and formats. Your chosen reporting tool should effortlessly handle such complexities. Additionally, it should offer rich visualization options, including tables, graphs, and charts, to enhance data comprehension.
Checking mobile device compatibility of the reporting tool
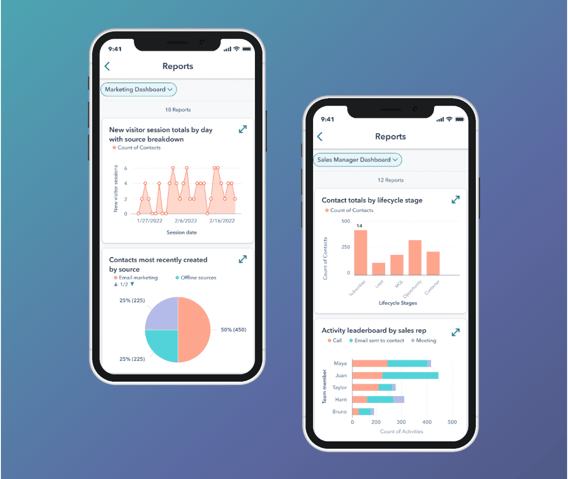
In today's "post-PC" era, mobile accessibility is very important. Opt for a reporting tool with dedicated mobile applications, enabling you to access reports anytime, anywhere. These apps should allow for periodic report delivery and real-time alerts, ensuring you stay informed even on the go.
Examining supported export and printing formats of the tool
Flexibility in exporting reports is essential for seamless sharing and in-depth analysis. Ensure the report generating software supports a wide array of export formats, including PDF, Word, Excel, and images. Likewise, robust printing capabilities, such as page-break printing and scale printing, should be available to meet various printing requirements.
Confirming if the reporting software functions as an open application
An open application architecture offers extensive customization possibilities. Look for reporting software that supports web scripts, API interfaces, and plug-in development. This allows for deep customization and control, enabling you to build reporting systems tailored to your specific needs.
Final Words
In conclusion, selecting the right reporting tool is a crucial decision that can significantly impact your organization's efficiency and success.
Whether streamlining collaboration, gaining actionable insights, or enhancing productivity, the right reporting tool empowers businesses to make informed decisions and achieve their goals effectively.
With our diverse range of the best tools for reporting listed today, there's no shortage of options to help you drive your business forward!

.png)