
What is infrastructure monitoring?
Infrastructure monitoring gathers health and performance information from servers, virtual machines, containers, databases, and other backend components in a technology stack. Engineers can utilize infrastructure monitoring software to visualize, analyze, and alert on metrics to determine whether a backend issue is affecting users.
[Related article: A Comprehensive Insight RMM Software Tools]
Check out the CRM systems listed below—they're top players in the market. Keep an eye on them for a comprehensive solution:


.png)
What components of an organization can be monitored with software?
Organizations utilize software to monitor a variety of components, including network infrastructure, servers, applications, databases, cloud resources, virtual environments, containers, end-user experience, security, compliance, and environmental conditions.
Comprehensive monitoring IT infrastructure enables proactive issue resolution, performance optimization, enhanced security, and reliable operations across the IT infrastructure.
What are the common challenges associated with infrastructure monitoring?

Navigating complex backend systems presents challenges in selecting the best IT infrastructure monitoring tools, especially during cloud migration. Traditional tools, designed for on-premise setups, struggle to monitor dynamic cloud-native components like containers and serverless functions. Legacy tools often lack integration with cloud services and require manual access to retrieve metrics, consuming time.
Cultural silos between Dev and Ops teams make it difficult to monitor challenges. Unified monitoring tools facilitate collaboration, enabling teams to prioritize and resolve performance issues effectively. Integrating infrastructure and application performance metrics enhances troubleshooting, providing context for identifying the root causes of issues, whether they stem from resource consumption, application bugs, connectivity issues, or other factors.
[Related article: 15 Important Benefits of Remote Management and Monitoring]
What are the best practices for implementing and configuring an infrastructure monitoring system?
Here are the best practices for implementing and configuring an infrastructure monitoring solution to align with your business objectives and enhance overall system health:
- Define key metrics and KPIs: Start by selecting and prioritizing key performance indicators (KPIs) that align with your business goals and overall system health.
- Set thresholds and alerts: Establish clear thresholds for normal and abnormal behavior, and configure alerts to notify you immediately when these thresholds are exceeded.
- Monitor across layers: Ensure comprehensive monitoring across all layers of your infrastructure, including networks, servers, applications, and databases, to gain a holistic understanding of system performance.
- Choose the right tools: Select technologies and monitoring tools that best suit your infrastructure needs, considering factors such as infrastructure type, required monitoring metrics, level of detail, cost, usability, and available support.
- Balance agent-based and agentless monitoring: Consider using a combination of agent-based and agentless monitoring approaches. While agent-based monitoring provides detailed data, it can impact system performance. Agentless monitoring is less intrusive but may collect less data. Combining both methods can offer a balanced approach, optimizing data collection without significant performance impact.
-1.png)
Key infrastructure monitoring benefits
A good infrastructure and application monitoring system enables:
- Enhancement of project performance.
- Improvement of user experience.
- Capability to ingest data from a variety of sources and handle it during both planned and unexpected traffic overloads.
- Monitoring of detecting and reporting failures, bad resource management, and performance decline trends over time.
- Using collected data to identify the main cause.
- Proactive monitoring can help prevent problems before they happen.
Top 10 best infrastructure monitoring tools in 2024
1. Better Stack
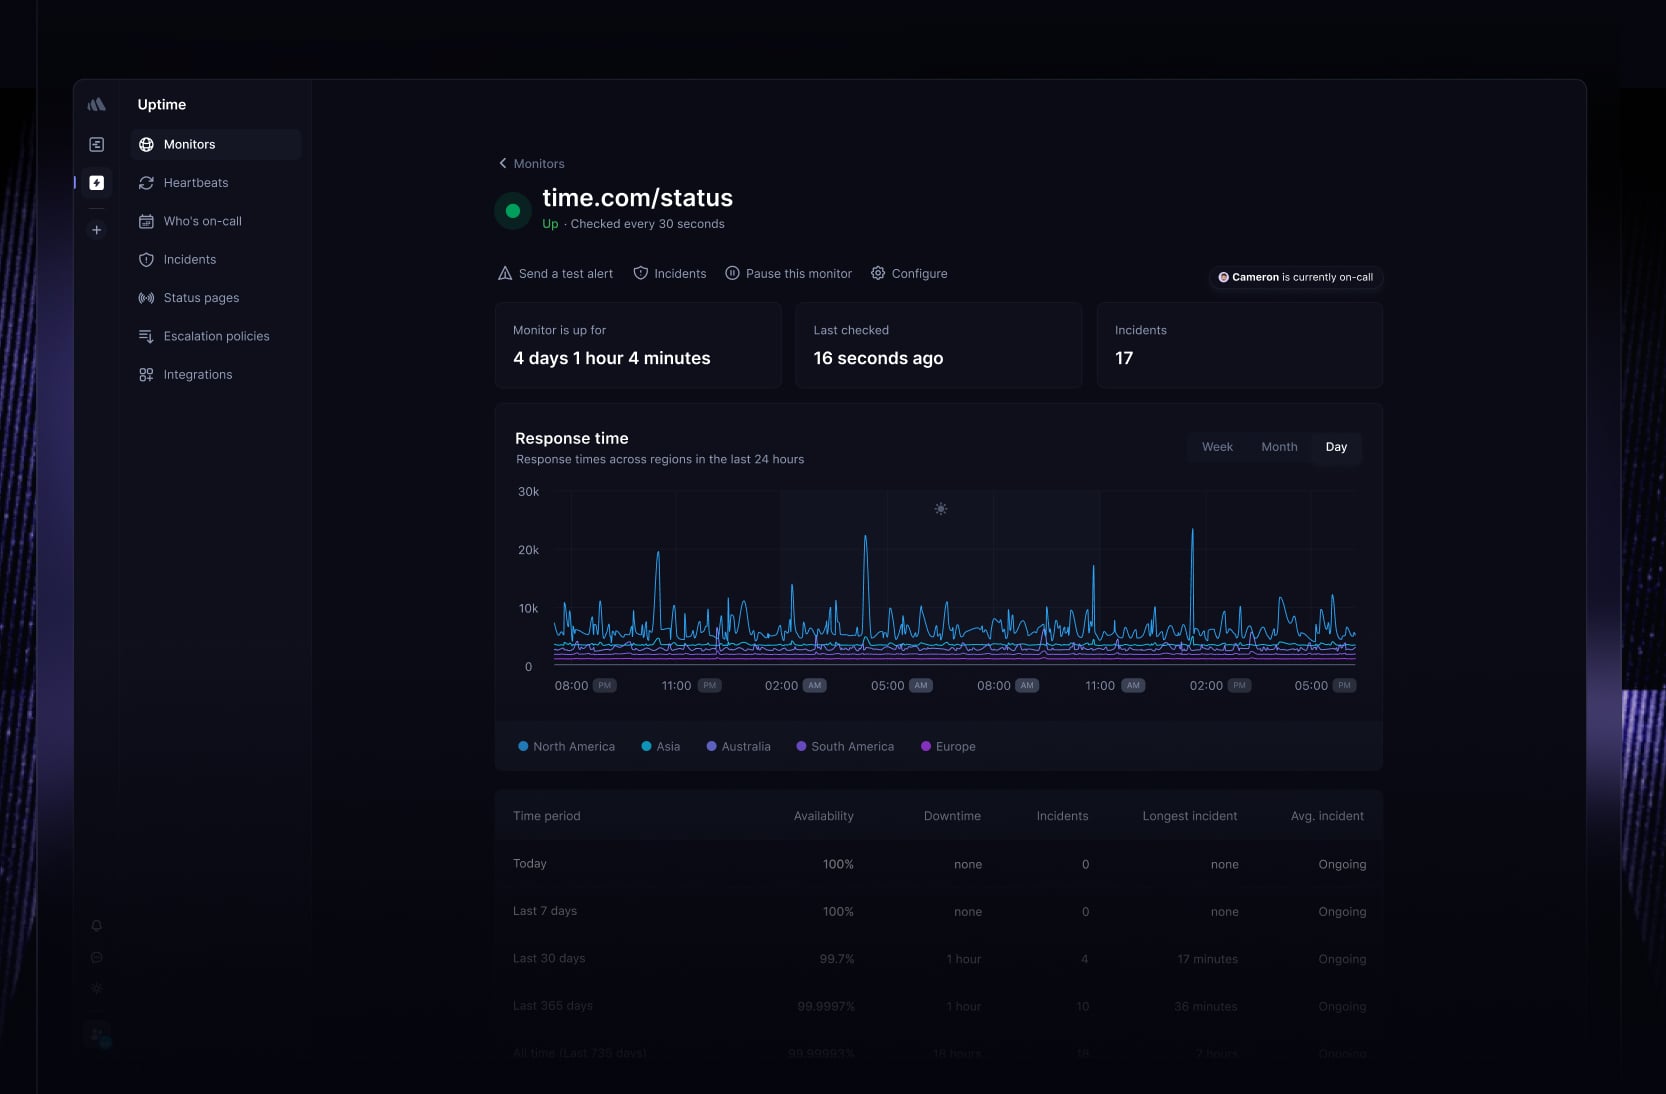
Better Stack is a cutting-edge infrastructure performance monitoring platform that provides a comprehensive array of monitoring resources. Its primary emphasis is on monitoring infrastructure, managing incidents effectively, and ensuring transparent communication during downtimes via Public Status Pages. Each incident, whether HTTP or ping-based, undergoes validation from multiple geographical locations to ensure alert credibility. Integration with leading platforms and unlimited phone call notifications inform you about any issues.
Better Stack includes monitoring for critical infrastructure elements like Website Uptime, Networks, Applications, and Cloud services. Every incident comes with a detailed timeline, updated second by second, and is streamlined using an intelligent merging tool, saving time and allowing you to concentrate on identifying root causes. Additionally, Better Stack includes Logtail, a contemporary log management solution. Together, these tools provide an unmatched full-stack monitoring solution, adaptable from startup ventures to large enterprises.
Key Features:
- Integration of Incident Management, Infrastructure Monitoring, and Status Pages.
- Seamless collaboration with Better Stack Logs for comprehensive monitoring capabilities.
- Transparent and reasonable pricing structure.
Pricing:
- Free plan.
- Freelancer: $25 per month, billed annually.
- Small Team: $85 per month, billed annually.
- Business: $170 per month, billed annually.
2. Splunk
Splunk is a dynamic data analytics and monitoring tool that allows organizations to gather, organize, and scrutinize vast quantities of data generated by machines. It boasts the capability to ingest data from a variety of sources like servers, applications, sensors, and devices, consolidating this data for thorough analysis.
With Splunk's search and reporting features, users can swiftly uncover valuable insights, track trends, pinpoint irregularities, and keep a real-time eye on system performance. Its visualization tools, including interactive monitoring dashboards and charts, facilitate comprehensive data presentation.
Furthermore, Splunk offers the flexibility to develop custom applications and integrate with other systems through its robust API, allowing organizations to tailor the platform to their unique requirements.
Key Features:
- Comprehensive data analysis from diverse sources.
- A wide range of visualization tools.
- Customization and extensibility through its robust API.
Pricing:
Custom pricing.
3. Datadog
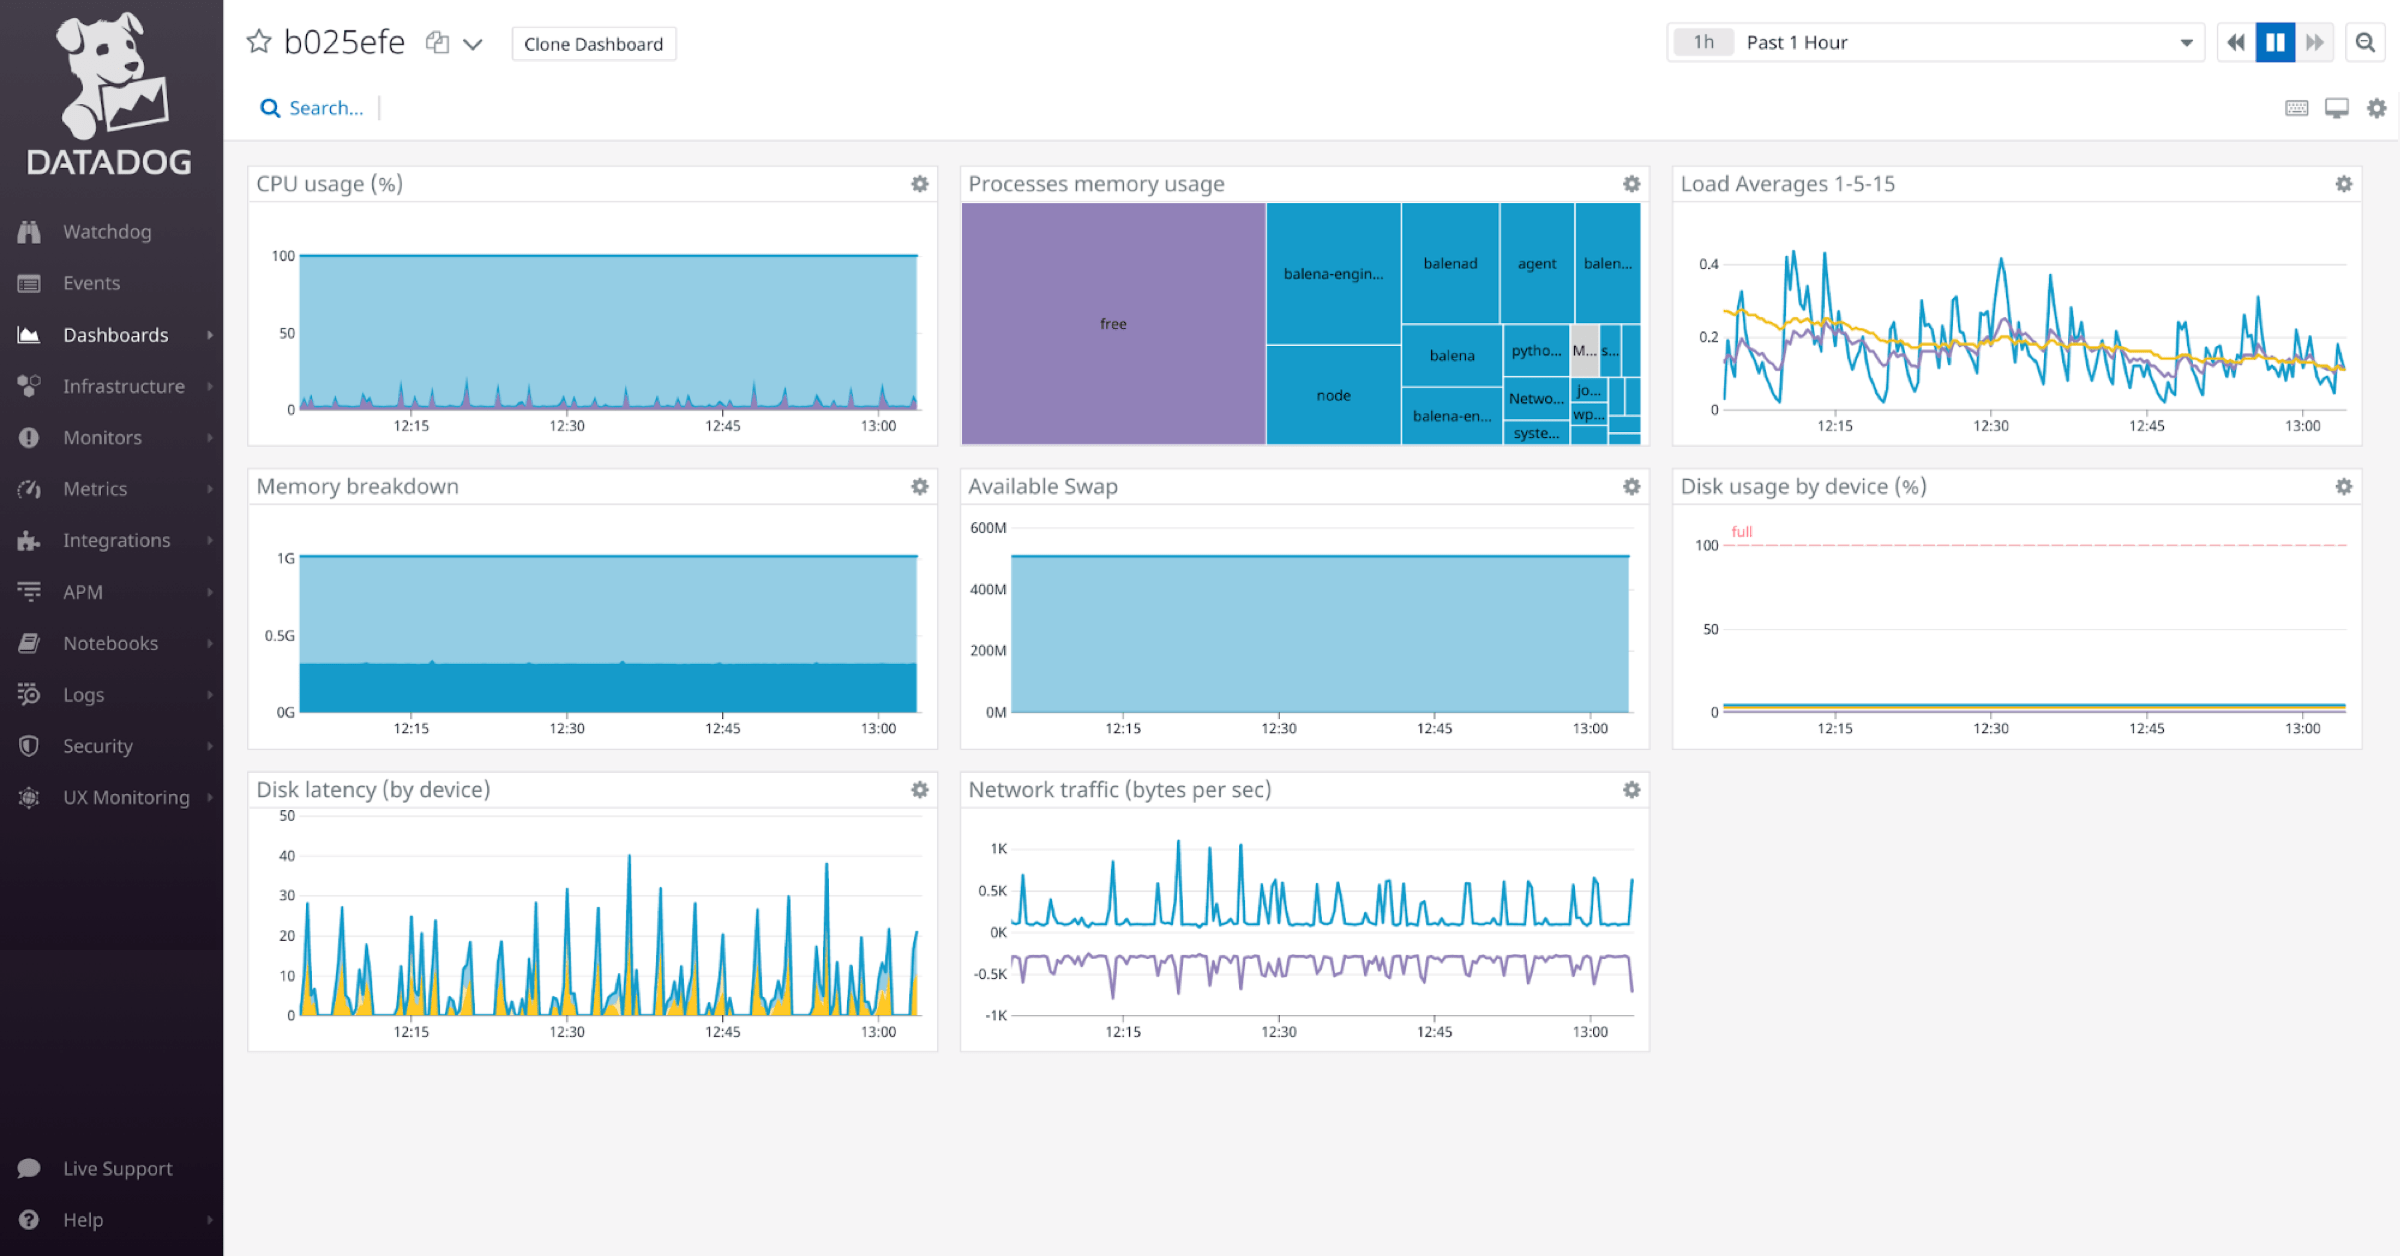
Datadog provides a holistic solution for monitoring infrastructure performance, offering easy deployment and minimal maintenance. With over 450 integrations from various vendors, you can monitor all your cloud services, on-premise servers, containers, databases, and more, all from one platform. Customizable drag-and-drop dashboards allow you to create and track essential information within seconds.
Datadog's infrastructure monitoring offers a complimentary subscription, including core collection and visualization features. Support is available through a discussion group, and you receive 1-day metric retention and can monitor up to 5 hosts. Moreover, Datadog ensures enterprise-grade security, along with features like Host and Container Maps, Out-of-the-box Dashboards, and access to product training videos.
Key Features:
- Custom metrics
- Over 450 integrations from various vendors
- Dashboard visualization
Pricing:
- Free plan
- Paid plans start at $15.
4. Dynatrace
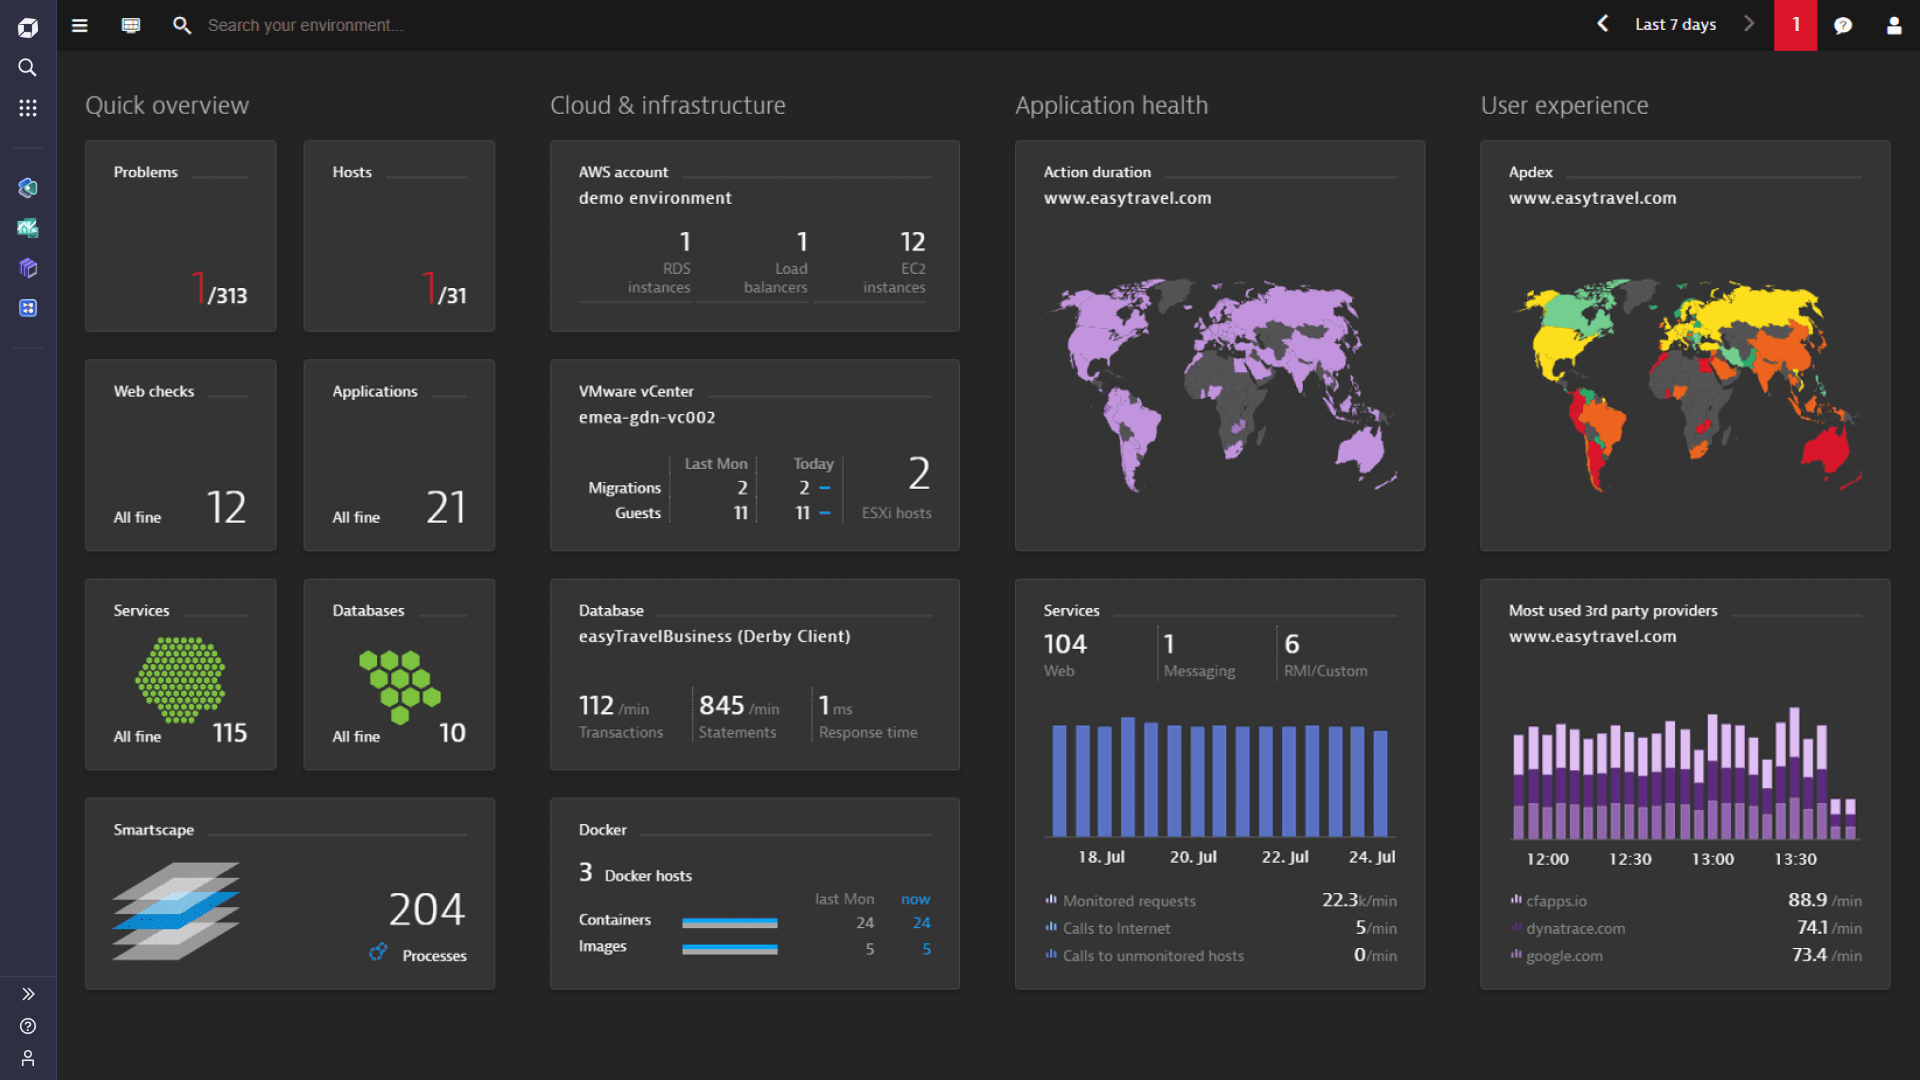
Dynatrace presents an integrated platform catering to comprehensive monitoring needs across the entire technology stack. It delivers pre-built insights into your infrastructure, effortlessly and at scale. The advanced observability it provides covers all aspects of your infrastructure, and it operates entirely automatically. Dynatrace gathers data from various sources including the cloud, hybrid environments, containers, virtual machines, networks, servers, and more.
With advanced observability extending to Platform as a Service (PaaS) and container technologies such as AWS, Azure, Kubernetes, and Cloud Foundry, Dynatrace offers insights into process detection, resource utilization, network performance, and log monitoring. Additionally, it facilitates holding partners accountable through third-party data integration, enabling verification of Service Level Agreements (SLAs).
Key Features:
- Automated monitoring, discovery, and mapping of dependencies
- Customizable dashboards
- Automation of incident management processes
Pricing:
Paid plans start at $0.01.
5. Prometheus
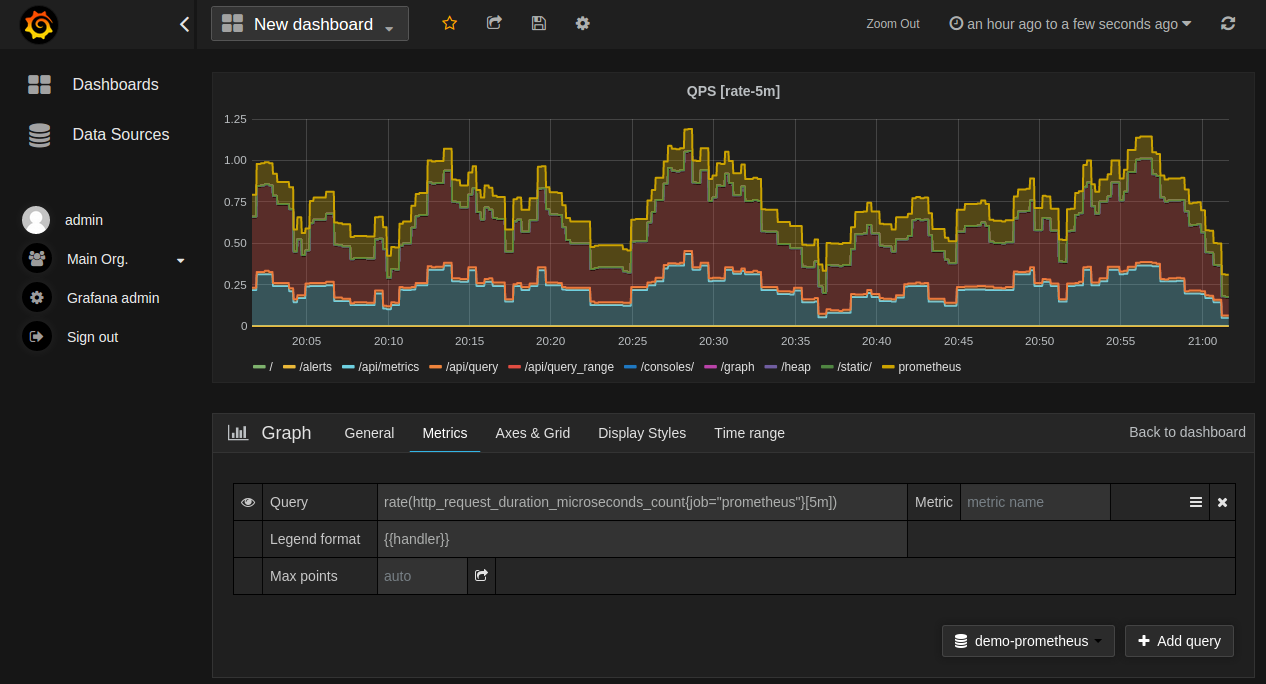
Prometheus, an open-source project accessible through GitHub under the Apache 2 License, has garnered over 40 thousand stars, signifying its popularity. Its architecture employs a highly dimensional data model, categorizing time-series data through metric names and key/value pairs. Users can leverage its flexible query language, PromQL, for versatile data analysis.
Primarily developed in Go, Prometheus collects metrics from instrumented jobs, stores them, and executes rules for data analysis, generating alerts if necessary. Grafana handles visualization tasks for Prometheus.
While Prometheus excels in providing reliable monitoring capabilities, it's not suitable for applications requiring 100% accuracy, such as per-request billing systems. Nevertheless, its documentation is well-written and open-source, supported by an active community of developers contributing to its ongoing improvement.
Key Features:
- Reliability in monitoring
- Open-source licensing and comprehensive documentation
- Community of engaged developers
Pricing:
The vendor does not provide pricing details on the website.
[Related article: Top 15 Endpoint Management Software]
6. Zabbix
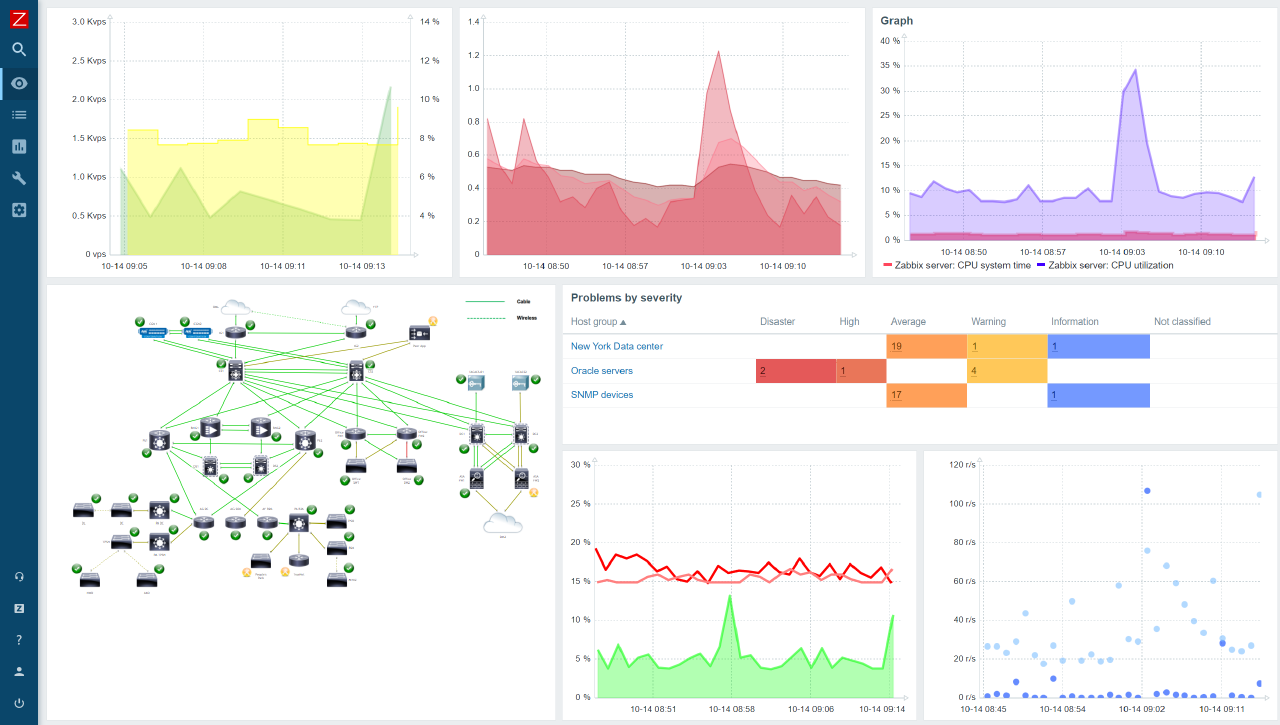
Zabbix is a monitoring tool, ready for enterprise use and licensed under GNU GPL2. It covers everything from network monitoring to server and cloud monitoring, as well as applications and services. Whether you prefer on-premise deployment or utilizing one of the supported cloud platforms, Zabbix offers seamless scalability and quick deployment, typically taking no more than 10 minutes. Its widget-based dashboards allow for easy customization through drag-and-drop features.
With Zabbix, you can gather metrics from various sources including network devices, cloud services, containers, virtual machines, databases, and more. Alerting is supported through multiple platforms such as On-Call, Opsgenie, Pagerduty, Slack, MS Teams, Telegram, or Webhooks.
Zabbix provides a comprehensive range of educational resources, including seminars and materials leading to recognized certificates, validating proficiency in Zabbix's functionality. Zabbix operates on an open-source basis, meaning there are no subscription packages. However, users can opt for educational courses or seek advice through technical support or consulting services.
Key Features:
- One of the best open-source IT infrastructure monitoring tools with enterprise-grade capabilities
- A wide range of educational resources
- Customizable dashboards
Pricing:
The vendor does not provide pricing details on the website.
7. AppDynamics
AppDynamics is a contemporary monitoring solution designed for enhancing effectiveness and modernization. It offers both on-premise deployment and Software as a Service (SaaS) options. Leveraging its full-stack capabilities, AppDynamics gathers, compares, and scrutinizes data across the entire infrastructure, expediting root-cause analysis.
Their intelligent optimization tool provides comprehensive visualization of every infrastructure component. AppDynamics boasts a wide array of solutions and tools, though its complexity may pose a challenge for some users. Additionally, the lack of automation during setup may be more suitable for experienced users.
Key Features:
- Real-time insights
- Customizable alerting
- Resource Optimization
- AppDynamics University for continuous learning
Pricing:
- Infrastructure Monitoring Edition: $6 per month per CPU Core, billed annually.
- Premium Edition: $33 per month per CPU Core, billed annually.
- Enterprise Edition: $50 per month per CPU Core, billed annually.
- Enterprise Edition for SAP® Solutions: $95 per month per CPU Core, billed annually.
- Real User Monitoring: $.06 per month per 1000 tokens, billed annually.
- Cisco Secure Application: $13.75 per month per CPU Core, billed annually.
8. Opsview Monitor
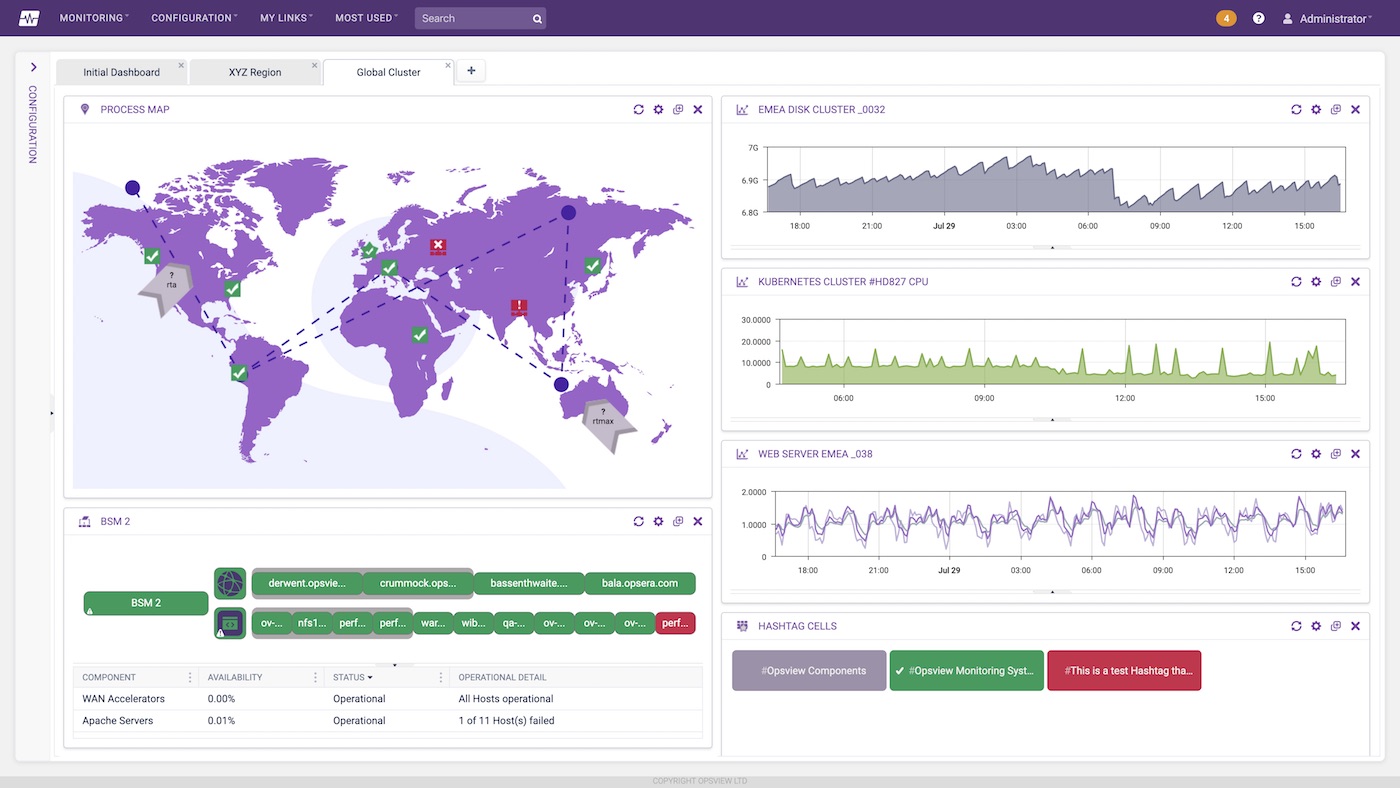
Opsview Monitor is a scalable and flexible monitoring platform that offers comprehensive visibility into the performance and availability of IT infrastructure, applications, and services. It provides monitoring for networks, servers, databases, virtualization, cloud environments, and more.
Opsview Monitor's customizable dashboards, reporting tools, and alerting mechanisms enable users to effectively monitor and manage their entire IT ecosystem. With its extensible architecture and integration capabilities, Opsview Monitor can adapt to the needs of IT environments.
Key Features:
- Comprehensive monitoring capabilities
- Flexible alerting
- Unified dashboard
Pricing:
- Opsview Cloud: Starts from 9 € per host per month.
- Enterprise: Starts from 5,75 € per host per month.
9. Zenoss
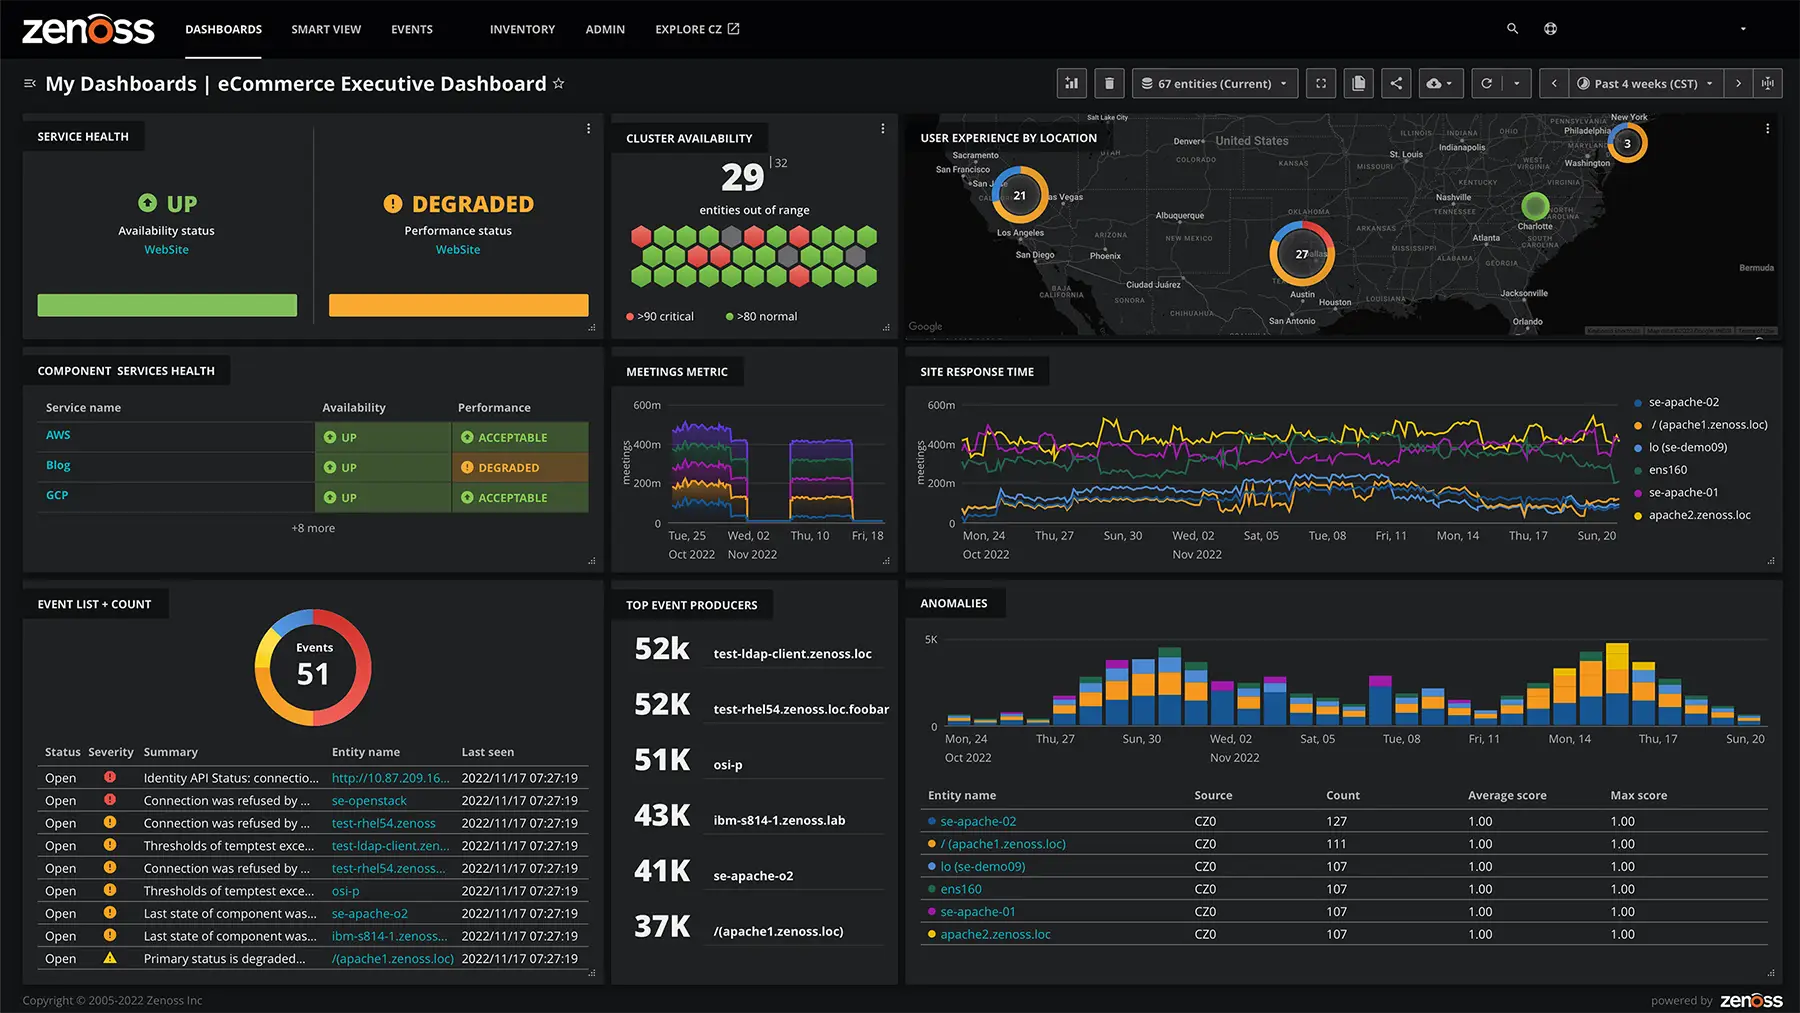
Zenoss Core is an open-source operating system that provides unified visibility into the health and performance of IT infrastructure and applications. It offers monitoring for servers, networks, storage, virtualization, and cloud environments.
Zenoss Core features dynamic discovery and auto-scaling capabilities, allowing it to adapt to changes in the infrastructure automatically. With its event management and correlation engine, Zenoss Core helps organizations quickly identify and resolve issues to minimize downtime and ensure optimal performance.
Key Features:
- Auto-discovery functionality
- Event management
- Custom dashboards
- Community support
Pricing:
Custom pricing.
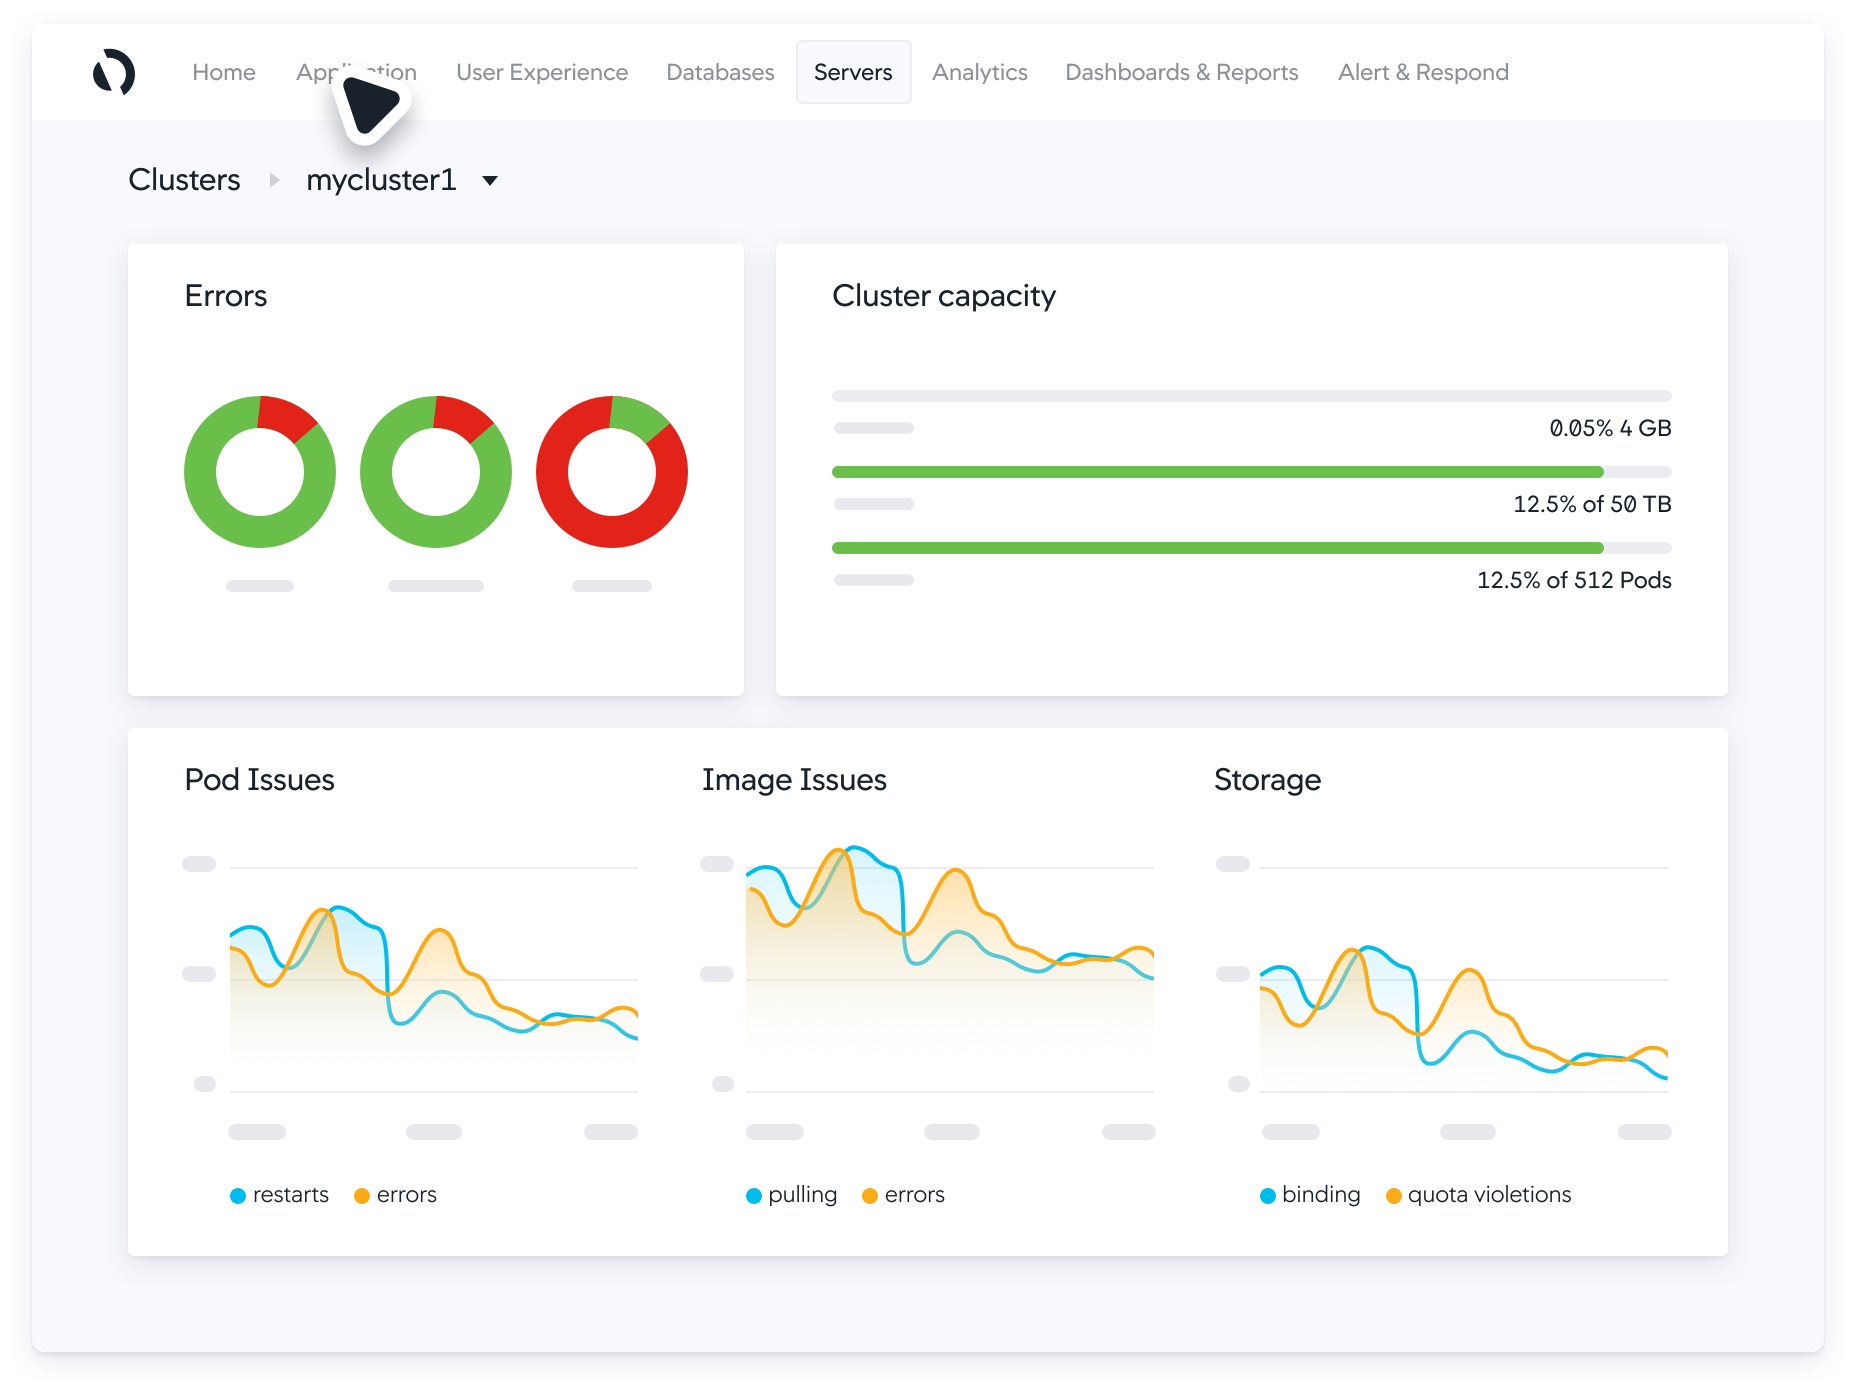
10. LogicMonitor
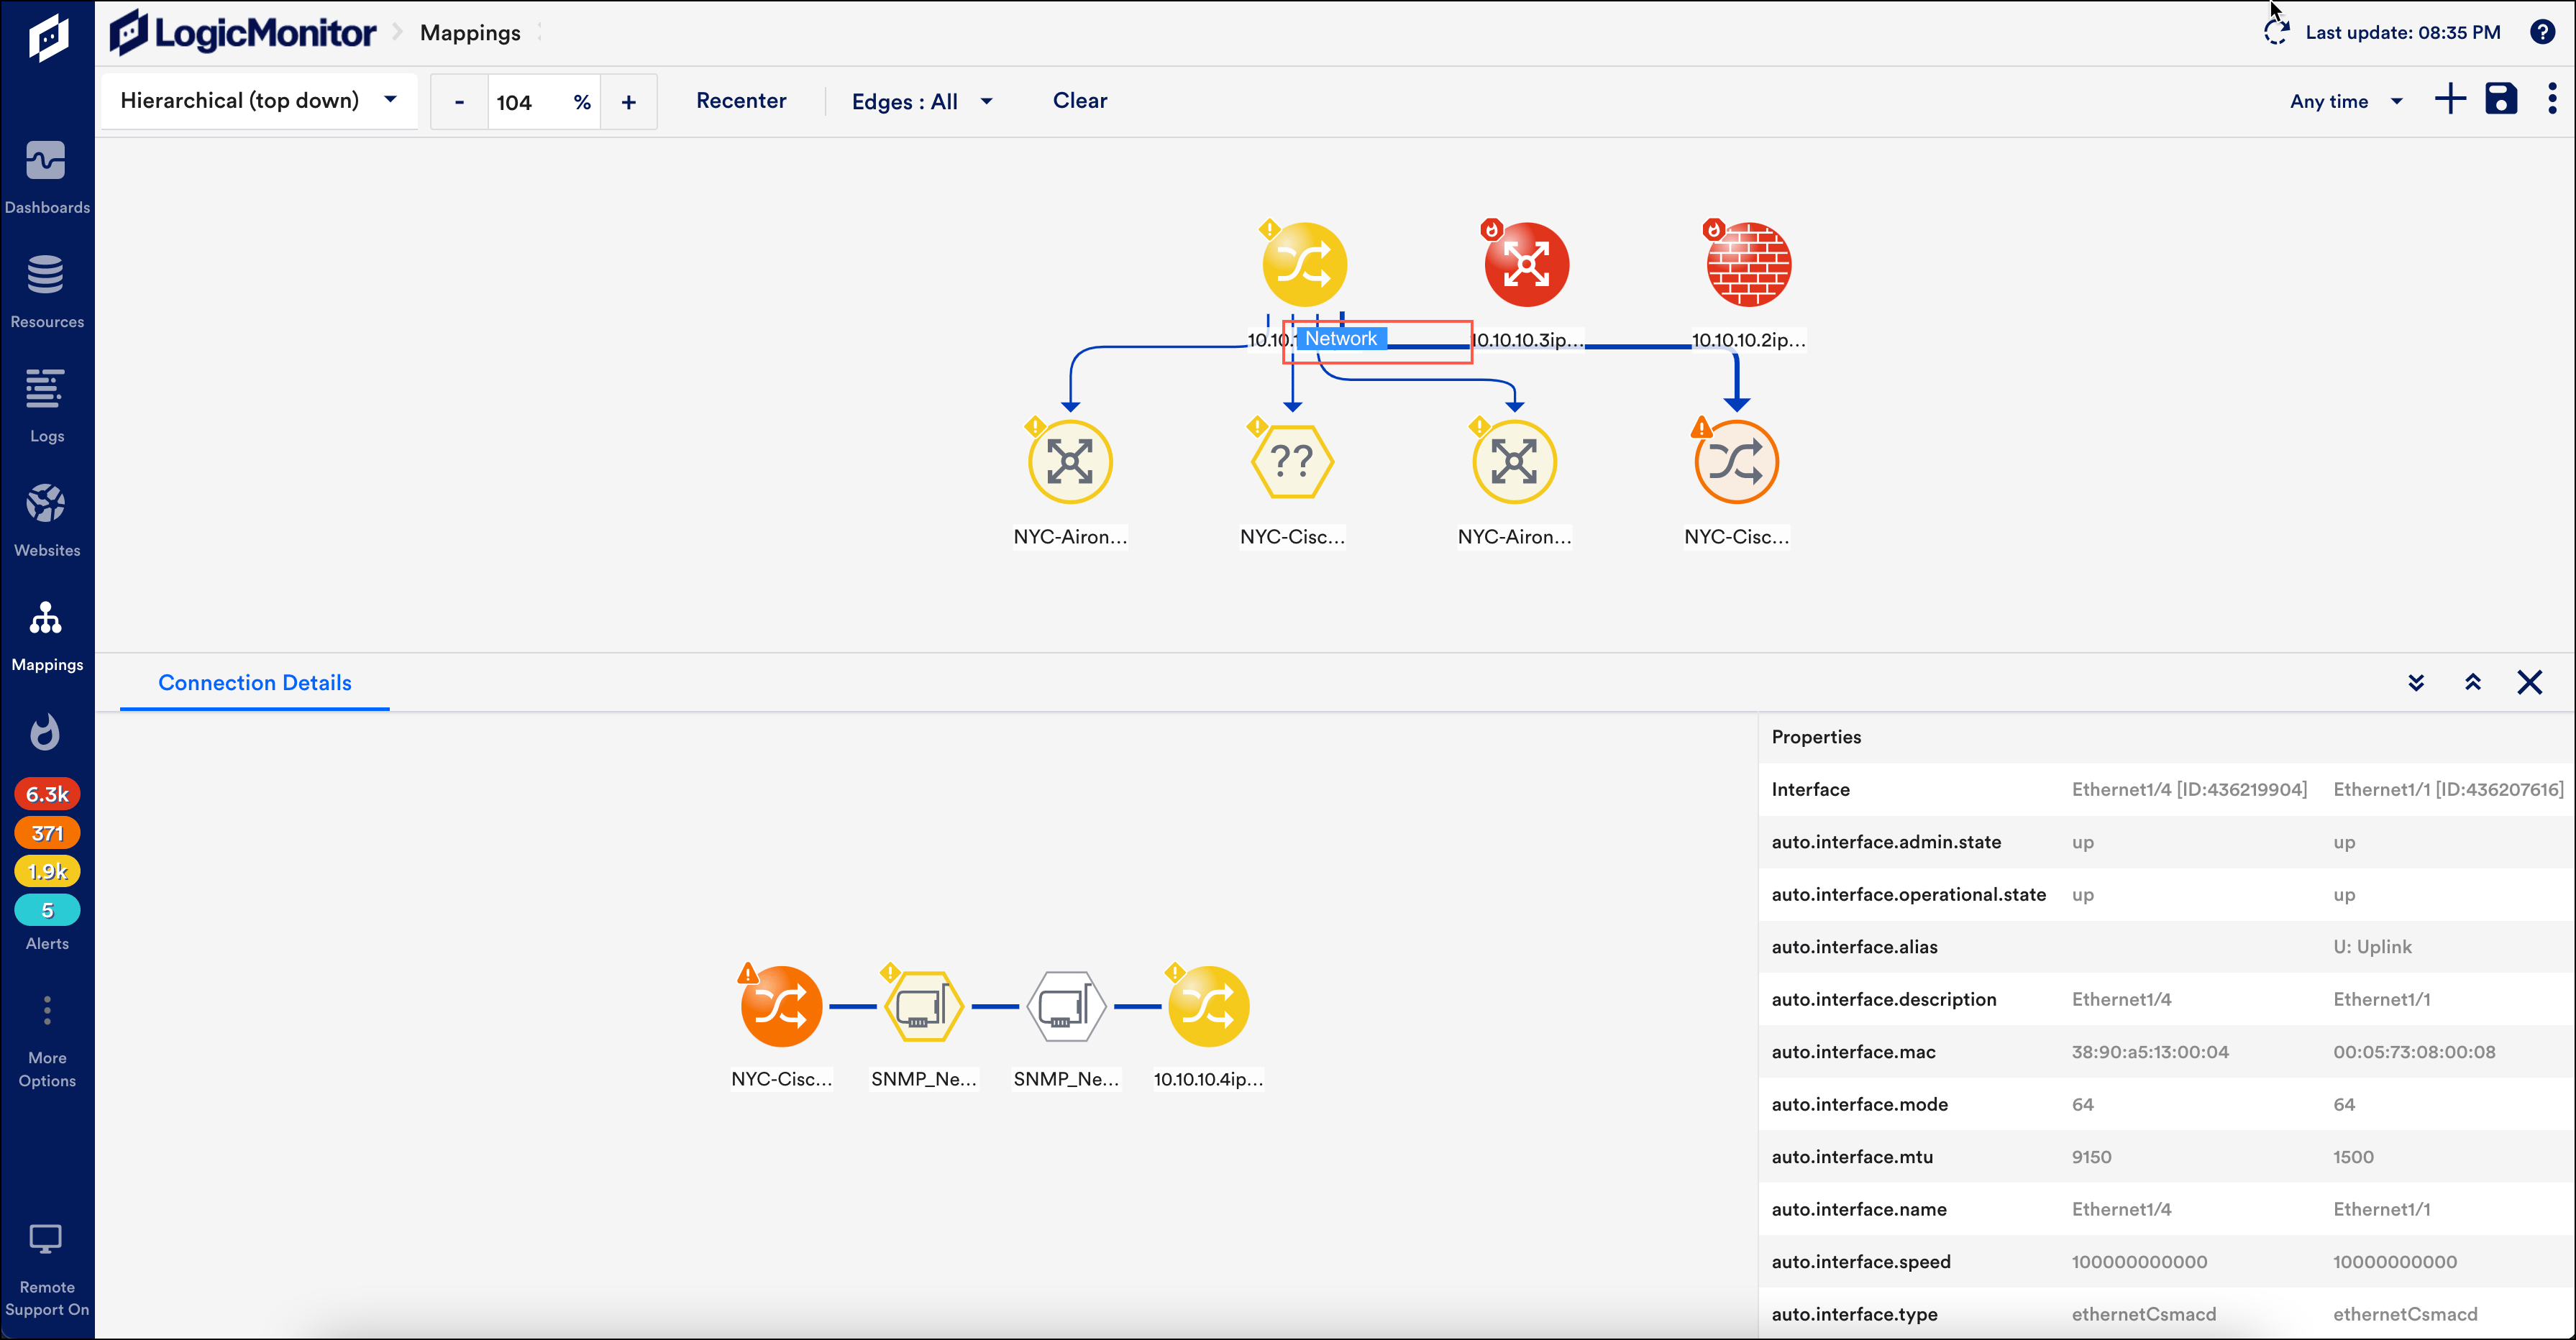
LogicMonitor is a cloud-based infrastructure application monitoring platform that offers automated monitoring and alerting for networks, servers, applications, and cloud services. It provides comprehensive visibility into the performance and health of your infrastructure, with customizable dashboards and reports.
LogicMonitor's machine learning algorithms analyze monitoring data to detect anomalies and predict potential issues before they impact operations. With its scalable architecture and easy deployment, LogicMonitor is suitable for businesses of all sizes looking to streamline their monitoring processes.
Key Features:
- Pre-configured monitoring templates
- Intelligent reporting
- Predictive analytics
- User-friendly interface
Pricing:
Paid plans start at $22.
How do infrastructure monitoring work, and what features should I look for in a monitoring solution?
Infrastructure monitoring tools work by continuously collecting and analyzing data from various components of an organization's IT infrastructure, such as servers, networks, applications, databases, and cloud services. This data is then used to monitor the performance, availability, and health of these components, identify potential issues or anomalies, and generate alerts or reports to notify administrators of any problems.
When selecting a monitoring solution, it's important to consider several key features:
- Comprehensive monitoring: Look for a solution that offers comprehensive monitoring capabilities across all aspects of your infrastructure, including servers, networks, applications, databases, virtualization, and cloud environments.
- Auto-discovery: A monitoring solution with auto-discovery functionality can automatically detect and monitor new devices or services as they are added to the infrastructure, reducing manual configuration efforts.
- Root-cause analysis: Get practical solutions to problems in real-time, right down to the code.
- Alerting and notification: Look for a system that provides customizable alerting and notification capabilities, allowing you to set up alerts based on specific thresholds or conditions and receive timely notifications via email, SMS, or other channels.
- Intelligent analytics: Consider a monitoring solution that leverages intelligent analytics and machine learning algorithms to identify trends, anomalies, and potential issues before they impact operations, enabling proactive problem resolution.
- User-friendly interface: Choose a monitoring solution with a user-friendly interface that offers intuitive dashboards, visualizations, and reports, making it easy for administrators to navigate and interpret monitoring data.
What is the difference between network monitoring and security monitoring?
Network monitoring primarily focuses on observing and managing the performance and functionality of a network. It involves tracking factors like bandwidth usage, traffic patterns, device availability, and overall network health to ensure smooth operation and troubleshoot any issues that may arise.
On the other hand, security monitoring is more concerned with detecting and responding to potential security threats or breaches within the network. It involves monitoring for suspicious activities, unauthorized access attempts, malware infections, data breaches, and other security incidents. Security monitoring aims to protect the network and its assets from cyber threats and ensure compliance with security policies and regulations.
[Related article: What are the functional & technical features of CRM software?]
How does infrastructure monitoring integrate with other IT processes?

Real-time infrastructure monitoring is tightly integrated with various IT processes to ensure smooth operations and efficient management of technology resources. It plays a pivotal role in incident management by identifying and alerting IT teams about potential issues in real-time, triggering prompt responses and resolutions to minimize downtime. Additionally, it provides valuable insights into recurring problems, facilitating problem management processes to conduct root-cause analysis and implement permanent fixes.
Moreover, IT infrastructure monitoring tools assist change management by assessing the impact of proposed changes on the IT environment, enabling teams to plan and implement modifications smoothly. It supports capacity planning by analyzing resource usage data and performance trends, helping organizations anticipate future requirements and optimize infrastructure investments.
Furthermore, infrastructure monitoring contributes to service level management by monitoring key performance indicators and service level agreements, ensuring that IT services meet agreed-upon standards. It also aids in configuration management by maintaining accurate inventories of IT assets and configurations, tracking changes, and ensuring compliance with configuration standards.
How can monitoring tools help optimize resource utilization and reduce operational costs?
Monitoring tools include valuable insights into resource usage and system performance, helping organizations optimize resource allocation and identify inefficiencies. By analyzing data trends, teams can right-size infrastructure, address performance bottlenecks, and prioritize resource allocation based on business needs. Automated remediation actions further streamline operations, reducing manual intervention and operational costs.
[Related article: Top 12 CRM Functionalities and Features List]
Final Thoughts

So, we've covered the fundamentals of infrastructure monitoring, why it matters, the advantages it brings, infrastructure monitoring strategy, and the ways to approach it. Afterward, we delved into the top tools for infrastructure monitoring. Now, the logical next move is to explore further, select the ones you resonate with, and determine which tool aligns best with your specific requirements.

.png)